The Ultimate C/C++ and Java Competitive Programming Execution Visualizer for VS Code
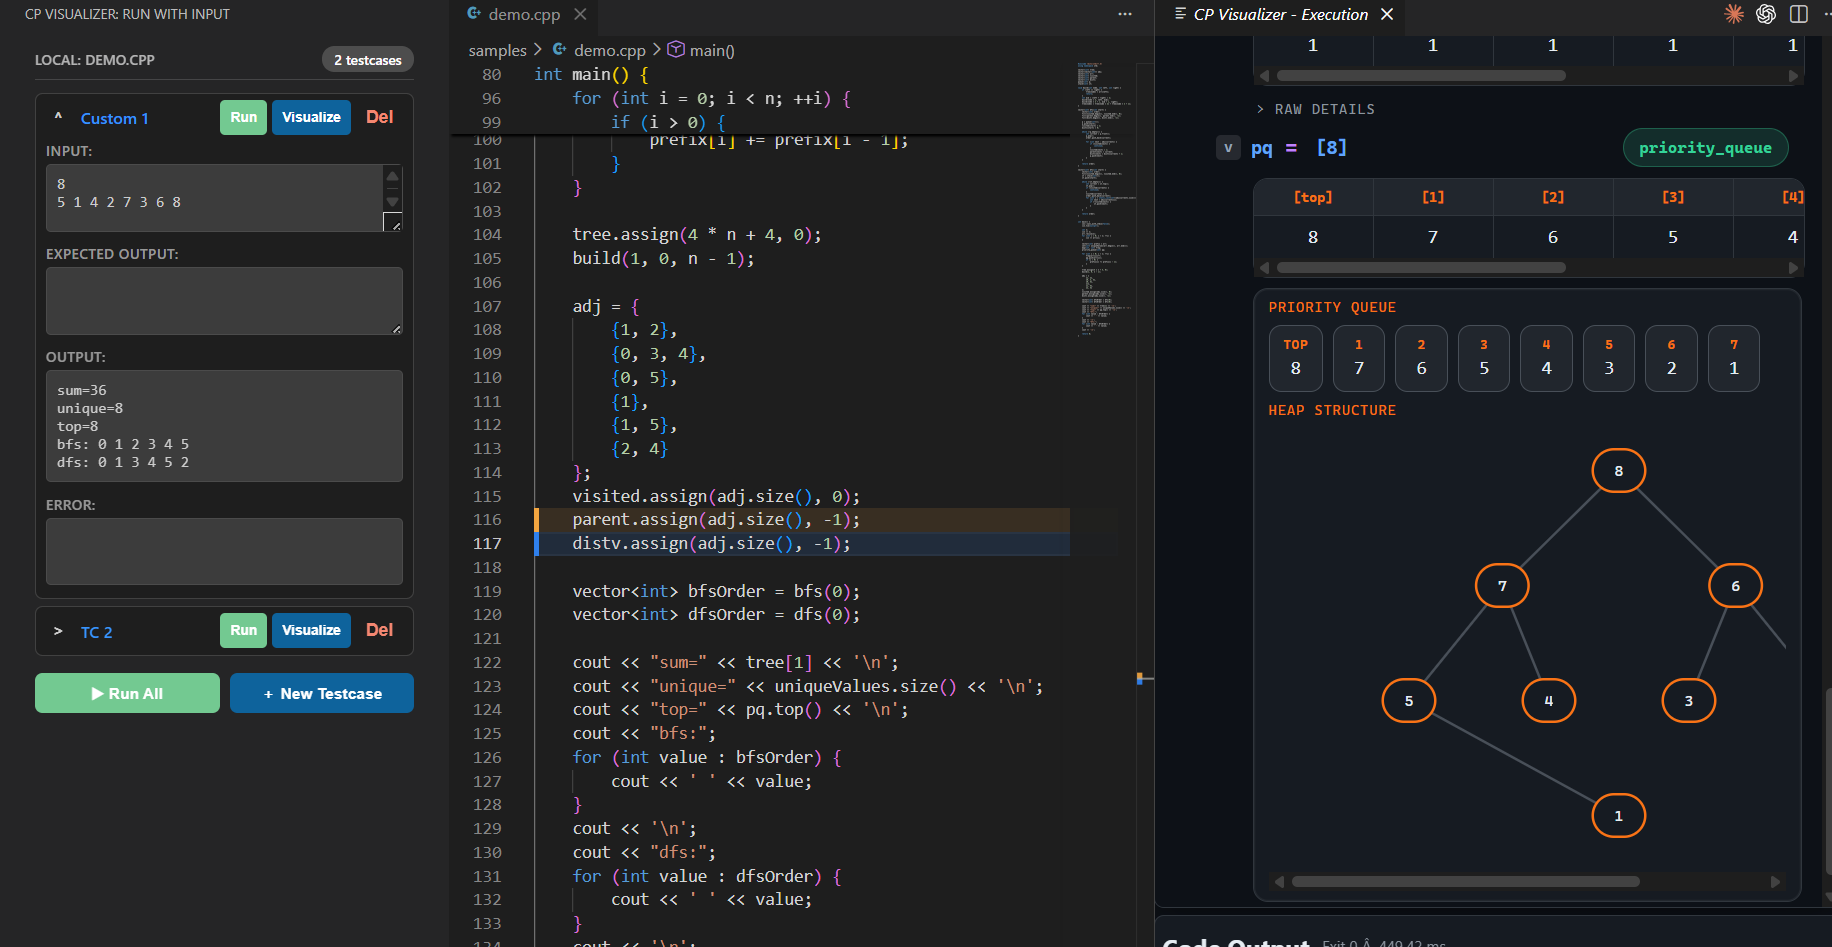
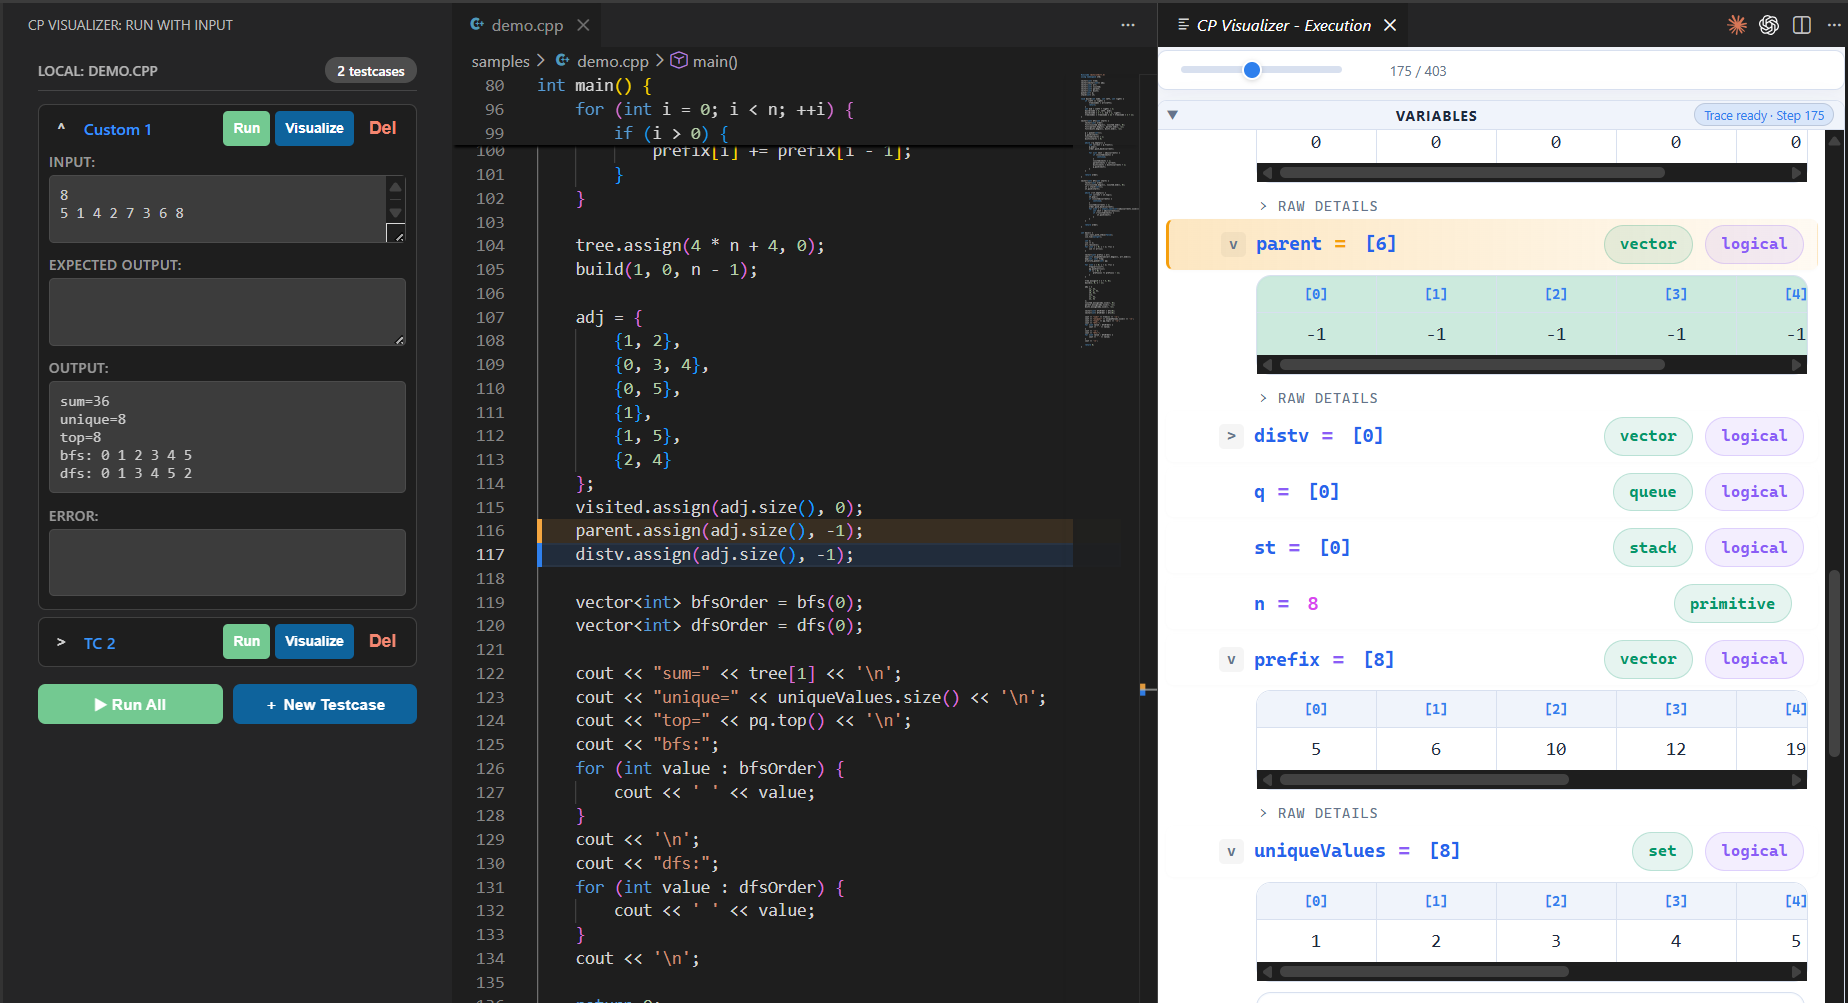
CP Visualizer is a focused VS Code extension designed specifically for competitive programmers. It seamlessly integrates a compact local runner and an advanced execution visualizer directly into your workflow, eliminating the need to constantly switch between your IDE and external online visualization tools.
💡 No Compiler Required! Are you tired of struggling to install GCC/MinGW or Java SDKs? CP Visualizer works out-of-the-box on any machine. If you don't have a local compiler installed, the extension seamlessly falls back to a free, cloud-based execution backend to run and visualize your code instantly.
🚀 Features
- Multi-Language Support: Fully supports C, C++, and Java!
- Fast Native Run Visualization: Compiles and runs your code natively to capture a high-speed execution trace, completely bypassing slow traditional debugger latency.
- Interactive Visualizer Panel: Step backward and forward through your code execution in real-time. Observe local variables, loops, and condition evaluations with precise editor line highlighting.
- Advanced Data Structure Rendering: Automatically detects and visually renders complex STL and Collections containers including:
vector,set,map,dequestack,queue,priority_queue- 1D Arrays and 2D Matrices (
vector<vector<T>>,int[][],int[n][n]) - Trees, Graphs, and Segment Trees (auto-detected via heuristic variable names like
adj,tree, etc.)
- Cloud Execution Fallback: No local compiler? No problem! The extension automatically falls back to a free, cloud-based Judge0 execution environment so anyone can visualize their code instantly.
- Pristine Workspaces: All temporary binaries and instrumented code files are quietly routed to your operating system's temp directory, keeping your project folder perfectly clean.
- Compact Custom Input Runner: Write, paste, and execute your code against custom inputs inside a sleek side-panel.
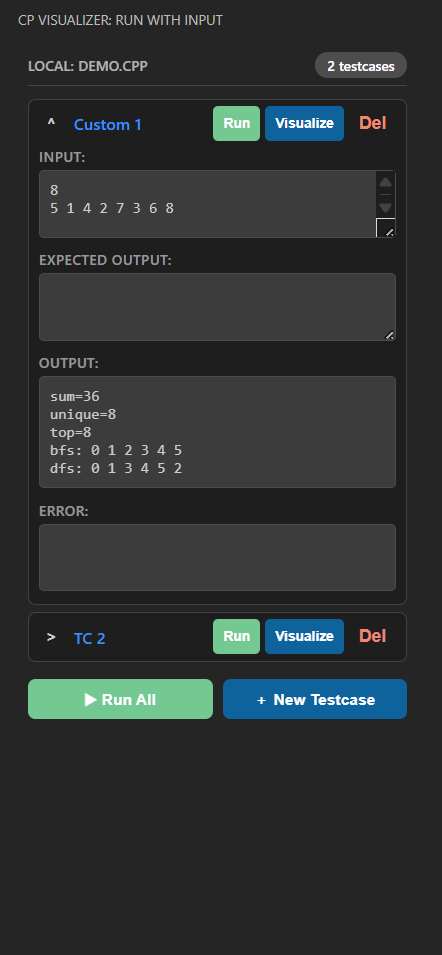
- Input Presets Management: Save, label, and manage multiple input test cases specific to each source file you work on.
- Competitive Companion Integration: Click the Competitive Companion extension icon in your browser to automatically download problems, extract test cases, and create ready-to-run
.cppfiles directly in your workspace! - 1-Click CPH Submit: Finished coding? Click the "Submit" button to instantly queue your solution and auto-submit it via the CPH Submit browser extension (supports Codeforces and CSES).
- Run All Testcases: Automatically loop through and run all of your saved testcases at once with a single click or keyboard shortcut.
- Context-Aware UI: A beautiful, premium visualizer panel that auto-expands only when data structures are traced, preventing screen clutter.
- Smart Auto-Focus: The visualizer automatically scrolls down and highlights any variables that just changed at the current execution step, ensuring you never miss an update!
- Dynamic Structural Rendering: Graphs and trees intelligently scale their layouts to prevent clipping—even for massive priority queues!
- Persistent Preferences: Your layout and theme preferences (like Dark Mode) are preserved permanently across all visualization sessions.
💡 Uses
- Debugging Complex Algorithms: Ever wondered how your BFS queue, DFS traversal, or dynamic programming state matrix evolves at each step? CP Visualizer paints a real-time picture of your data structures as they change.
- Rapid Prototyping & Testing: Quickly swap between different custom inputs to test edge cases without polluting your workspace with temporary text files.
- Learning & Teaching: An excellent tool for understanding exactly how standard library containers and graph algorithms operate under the hood during execution.
⭐ Advantages of Using This Extension
- Zero Friction Workflow: No need to copy-paste code into online visualizers. Everything happens instantly within your local VS Code environment (or seamlessly via the cloud if you don't have a compiler!).
- Extreme Performance: Because it uses a Fast Native Run strategy (source instrumentation rather than a slow DAP debugger step-through), it collects execution snapshots magnitudes faster than traditional debuggers.
- Scalable Views: Includes built-in virtualization to handle rendering thousands of array elements without lagging your editor.
- No Terminal Clutter: Executions and visualizer runs happen quietly in the background without constantly popping open the VS Code integrated terminal or Output panels—unless there is a compilation error you need to see.
⚙️ How to Use
- Open a
.c,.cpp, or.javafile containing your competitive programming solution. - Click the CP Visualizer icon in the left Activity Bar (or run
CP Visualizer: Run With Inputfrom the Command Palette). - Enter or load your custom input in the sidebar panel.
- Click
Runto quickly see the standard output. - Click
Visualize Codeto launch the interactive visualizer and step through your algorithm!
⌨️ Keyboard Shortcuts
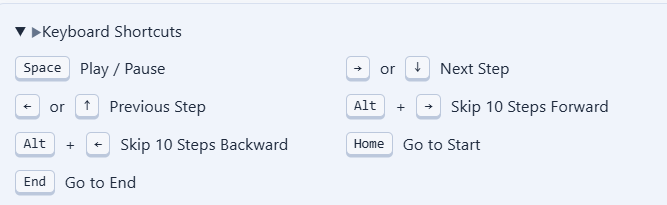
Visualizer Playback (While the visualization panel is focused):
Space: Play / PauseRight Arrow/Down Arrow: Next StepLeft Arrow/Up Arrow: Previous StepAlt + Right Arrow: Skip 10 Steps ForwardAlt + Left Arrow: Skip 10 Steps BackwardHome: Go to StartEnd: Go to End
Extension Commands:
Ctrl+Alt+R(Windows/Linux) orCmd+Alt+R(Mac): Run All Testcases for the currently active file.
🔧 Settings
Customize the visualizer to your workflow via VS Code Settings:
cpVisualizer.useCloudExecution: Control the cloud fallback behavior ("auto","always", or"never"). Defaults to"auto"(only uses cloud if no local compiler is found).cpVisualizer.compilerPath: Specify your local C++ compiler if you prefer local execution (default:g++).cpVisualizer.javacPath/cpVisualizer.javaPath: Specify your local Java compiler and runtime paths (default:javac/java).cpVisualizer.compilerArgs: Add specific compiler flags like-std=c++20.cpVisualizer.segmentTreeHints/cpVisualizer.graphHints: Tweak the variable names the visualizer looks for to automatically draw trees and graphs!