Profile Salesforce Apex debug logs directly inside VS Code. Right-click a .log
file, choose Profile Log, and get an interactive breakdown of Apex, Flow,
SOQL, DML, governor limits, recursion risk, and performance hotspots.
SF Profiler is built for the moments where a Salesforce debug log is technically complete but practically unreadable. It turns dense execution traces into a timeline, targeted insights, and limit views that make automation behavior much easier to explain.
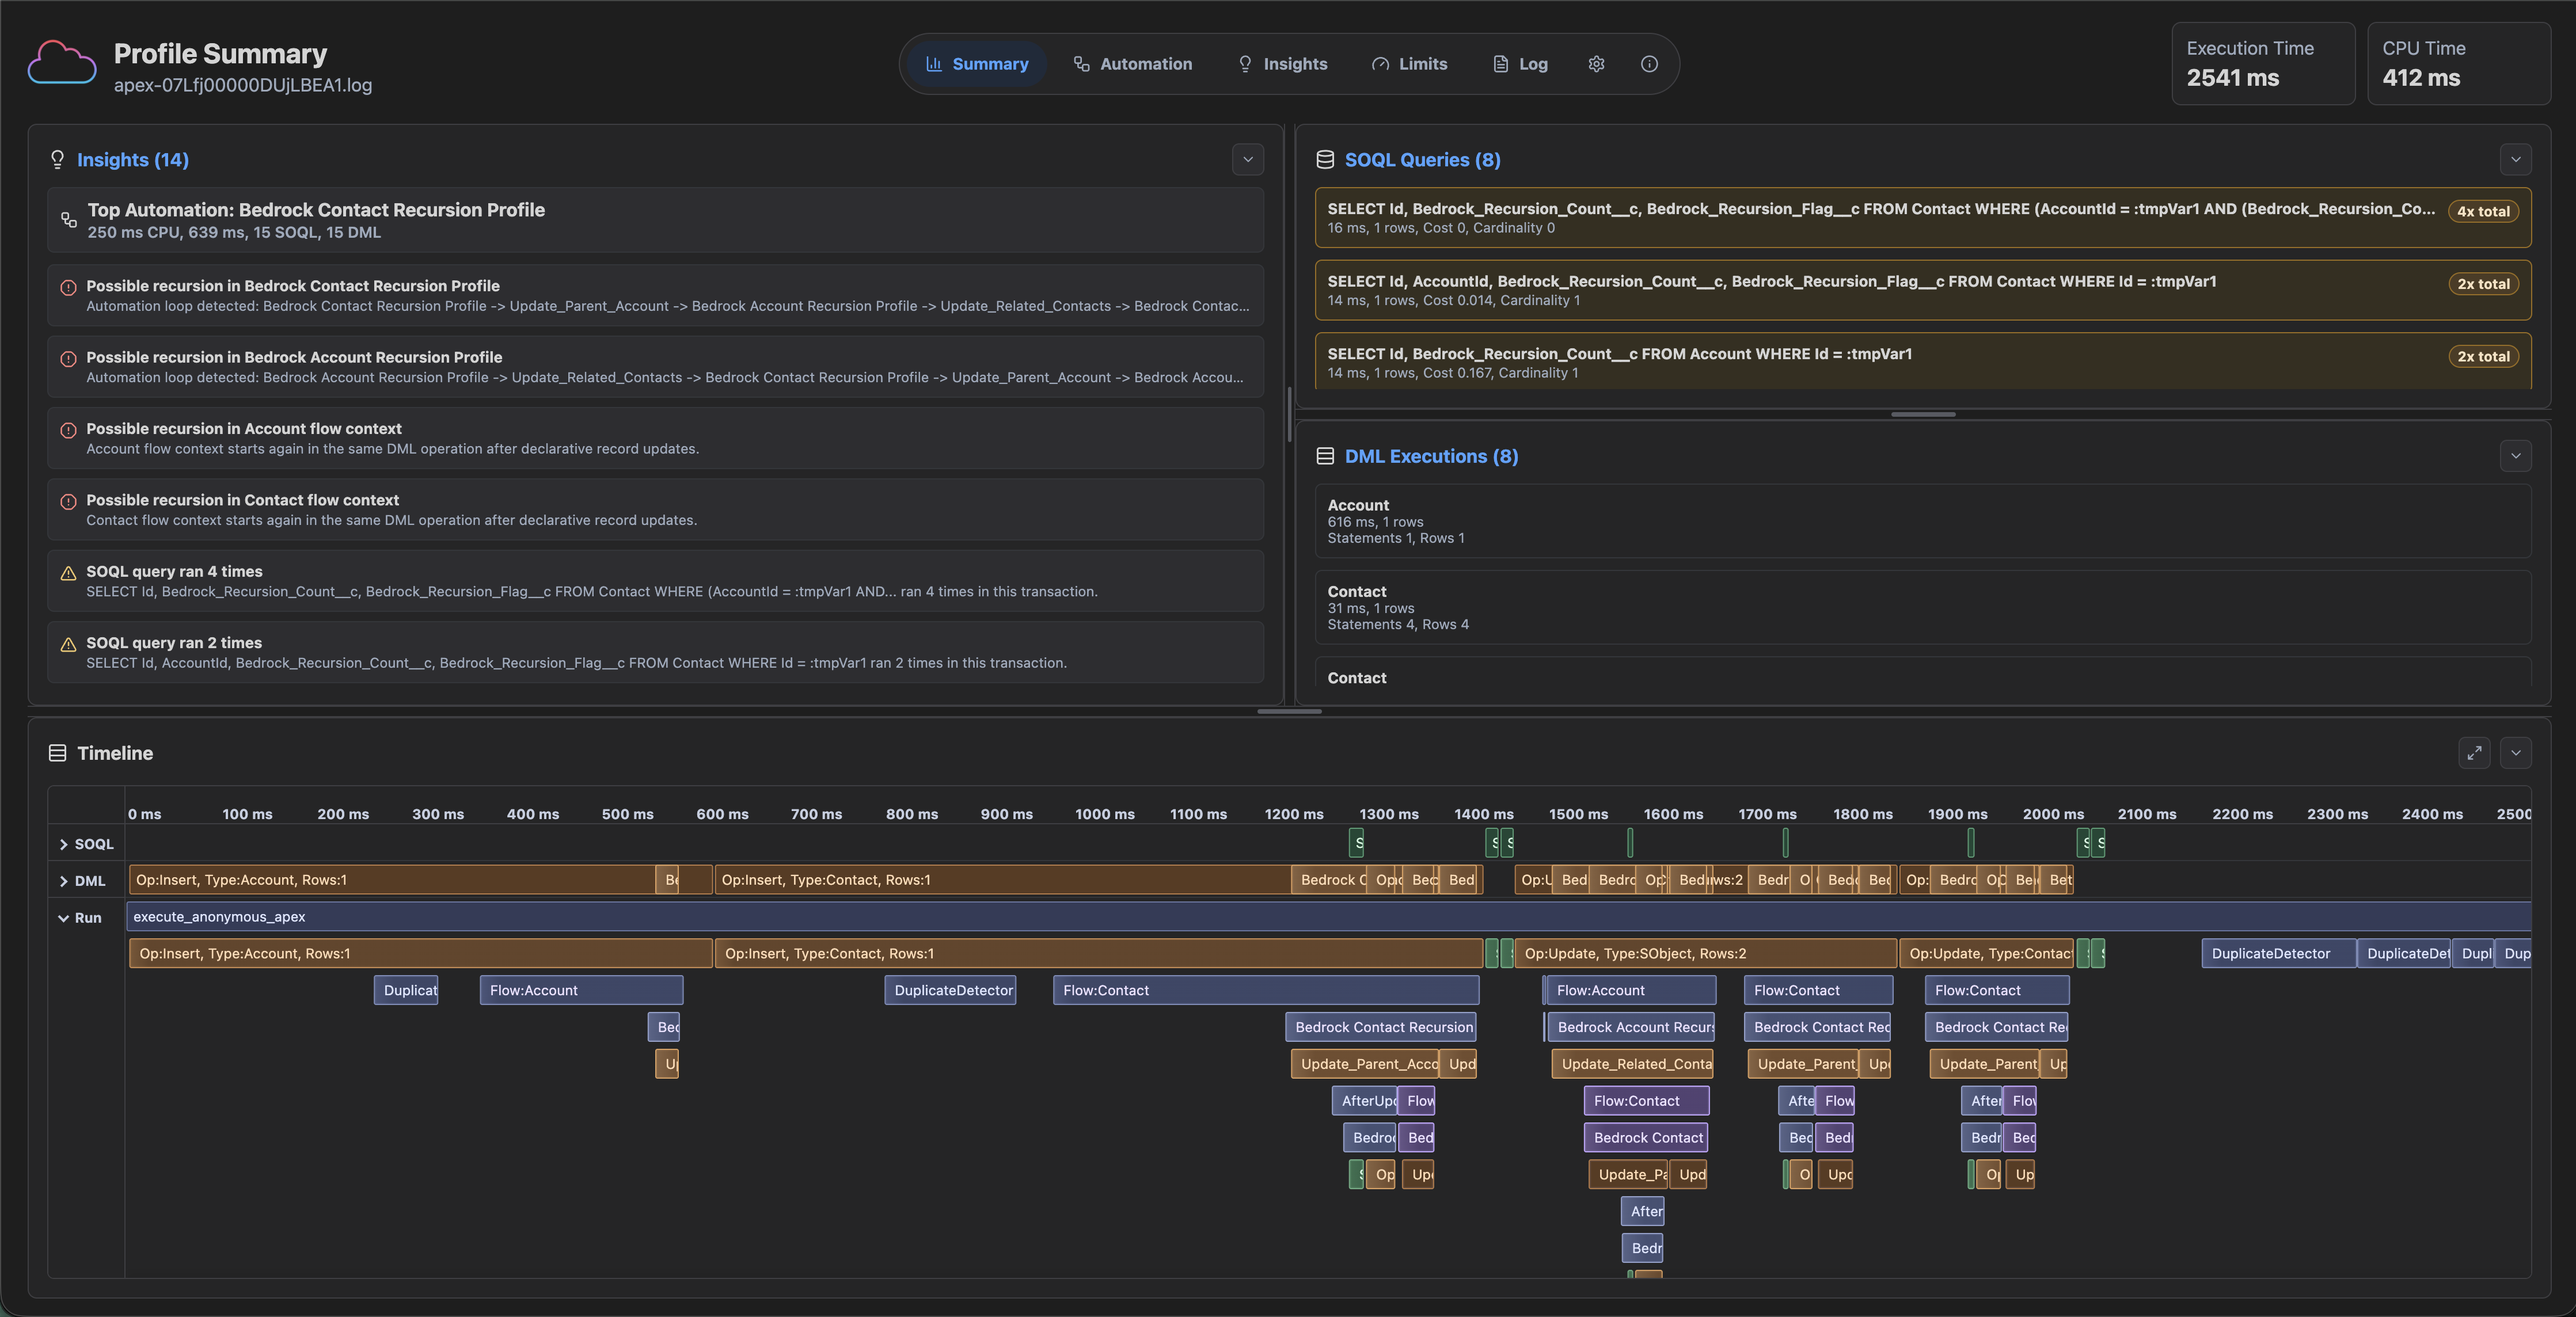
Why It Helps
- Declarative automation visibility: See Flow and other declarative automation alongside Apex, DML, and SOQL instead of treating them as separate mysteries.
- Recursion detection: Surface likely automation loops, repeated flow contexts, and recursive paths through DML.
- Performance insights: Find repeated SOQL, expensive execution patterns, and the parts of the transaction most likely to deserve attention.
- Governor limit context: Track SOQL, DML, async, CPU, heap, callout, and publish-immediate usage without manually hunting through raw log lines.
- Local processing: Logs are parsed in VS Code. Your debug log content does not need to leave your machine.
Recursion And Declarative Automation
The Insights view is where SF Profiler starts to earn its keep. It can identify probable automation recursion, show the detected cycle, call out likely causes, and list the path through Flow and DML that produced the loop.
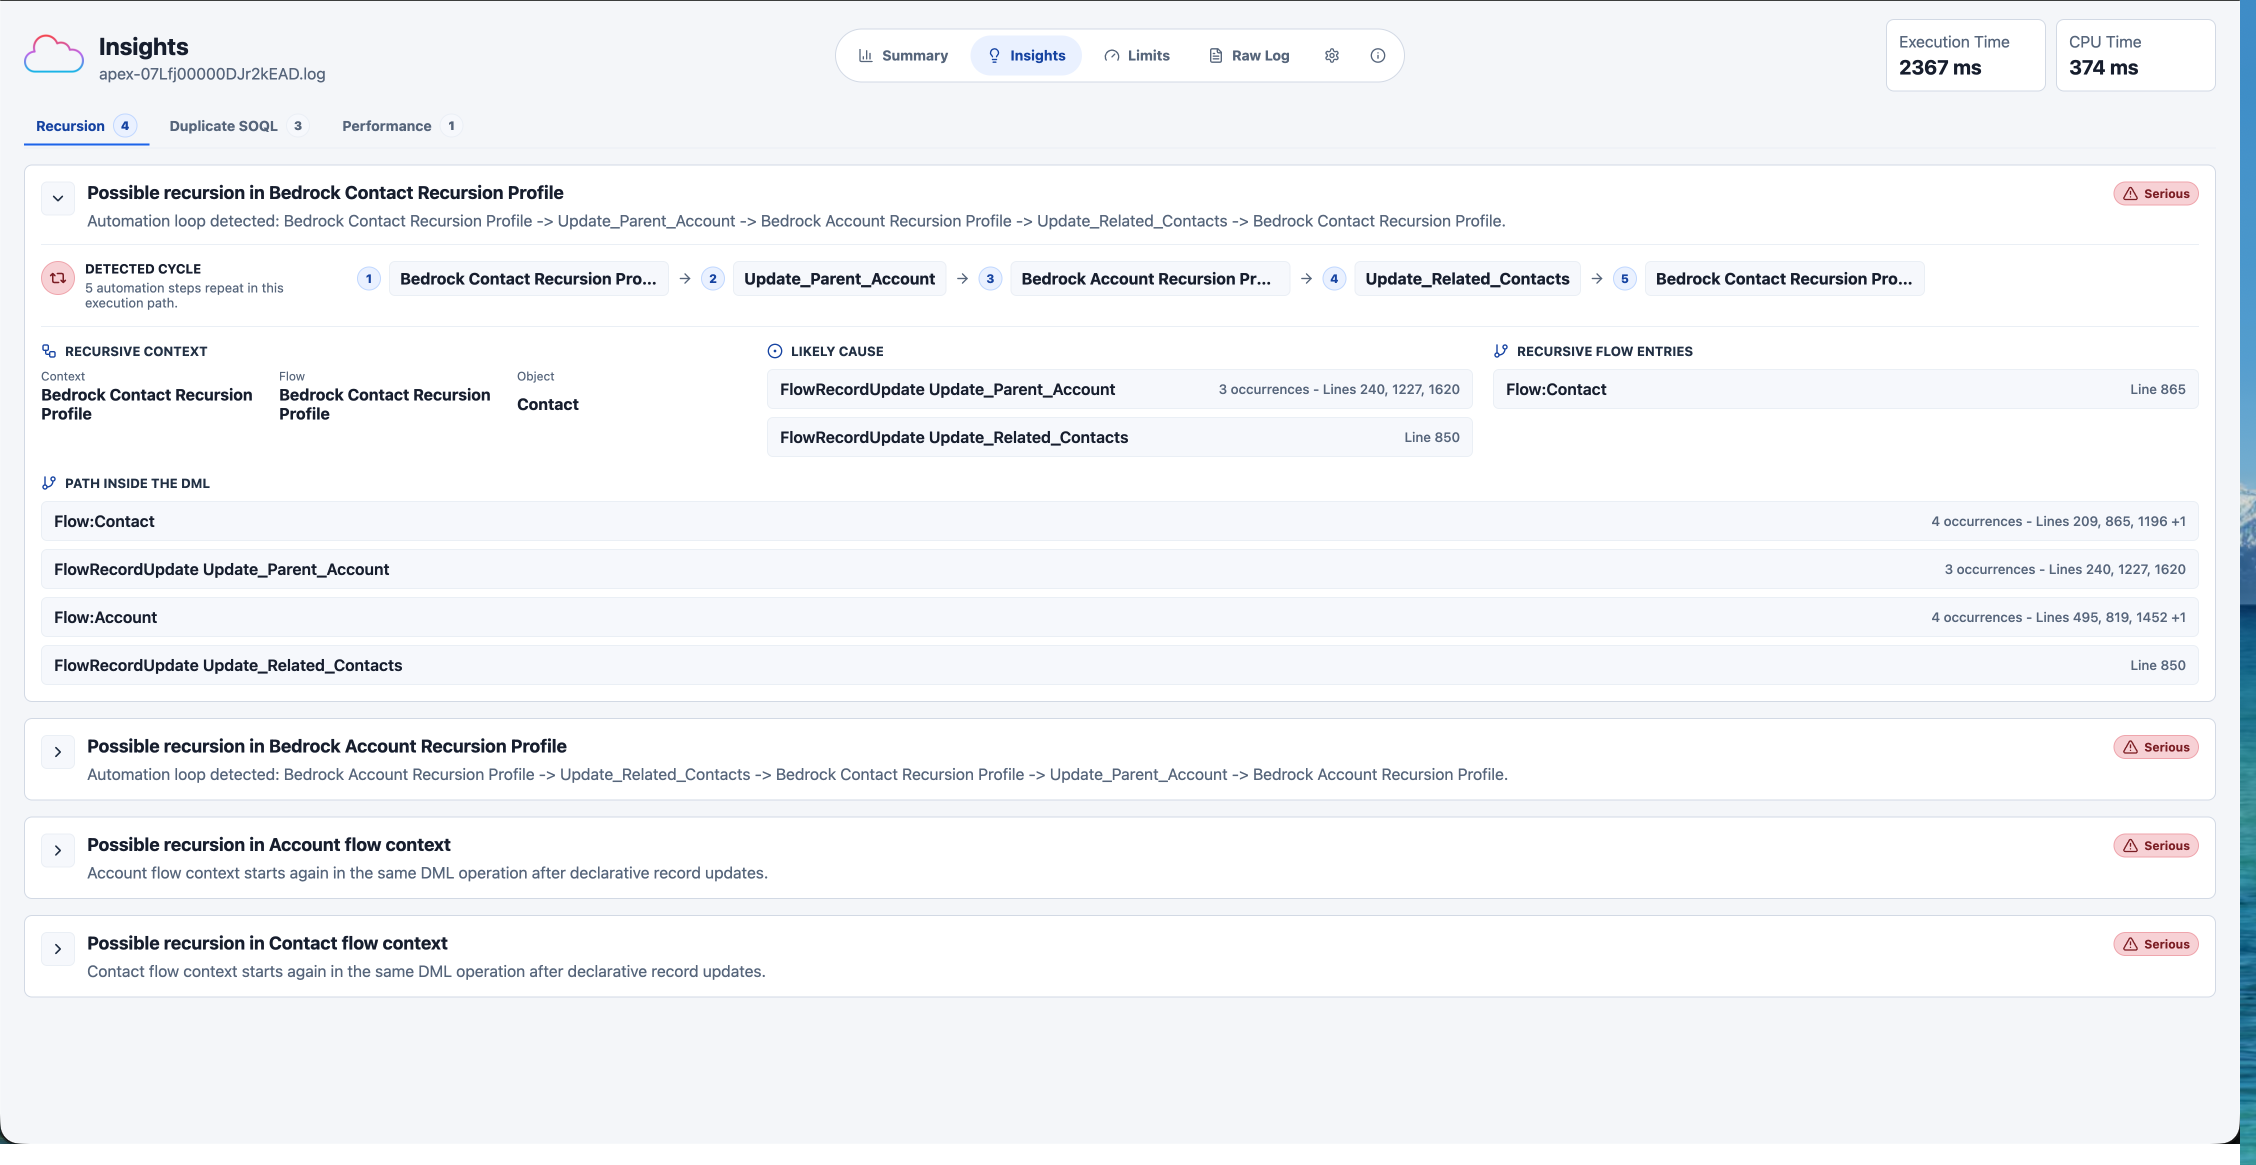
This is especially useful for record-triggered Flow, Process Builder leftovers, managed package automation, and mixed Apex/declarative transactions where the problem is not one line of code but a chain reaction.
Limits Without The Scavenger Hunt
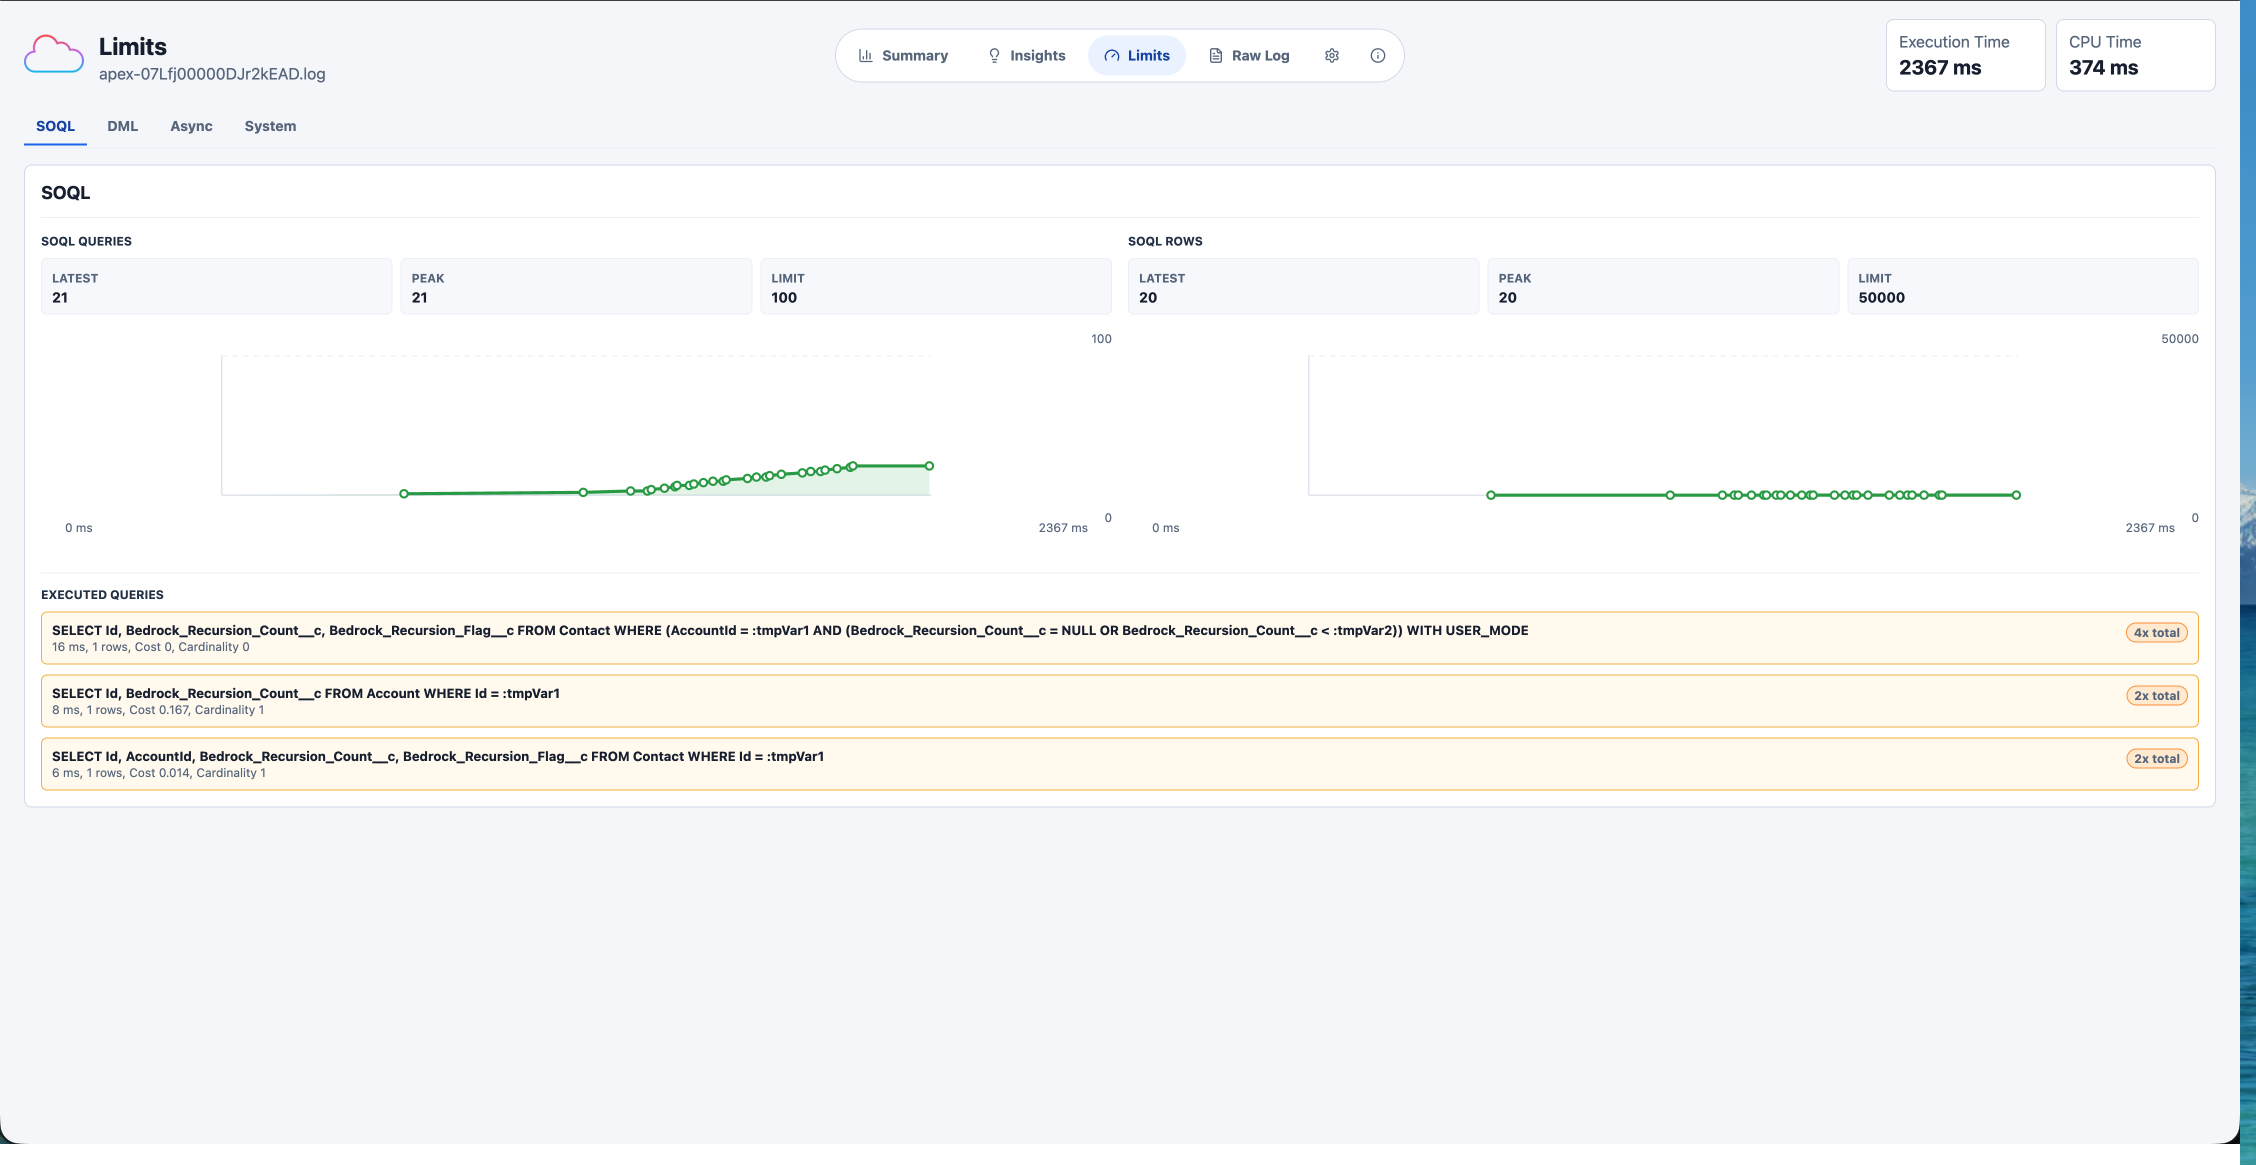
The Limits view groups governor usage and related executions so you can see what actually moved the counters. Repeated queries are grouped together, row counts and timings stay visible, and you can jump from the symptoms back into the timeline.
Timeline For The Whole Transaction
The timeline connects the transaction in execution order: Apex, Workflow/Flow, SOQL, DML, and other events. It is designed for the “what happened first?” and “why did this happen again?” questions that raw debug logs make painful.
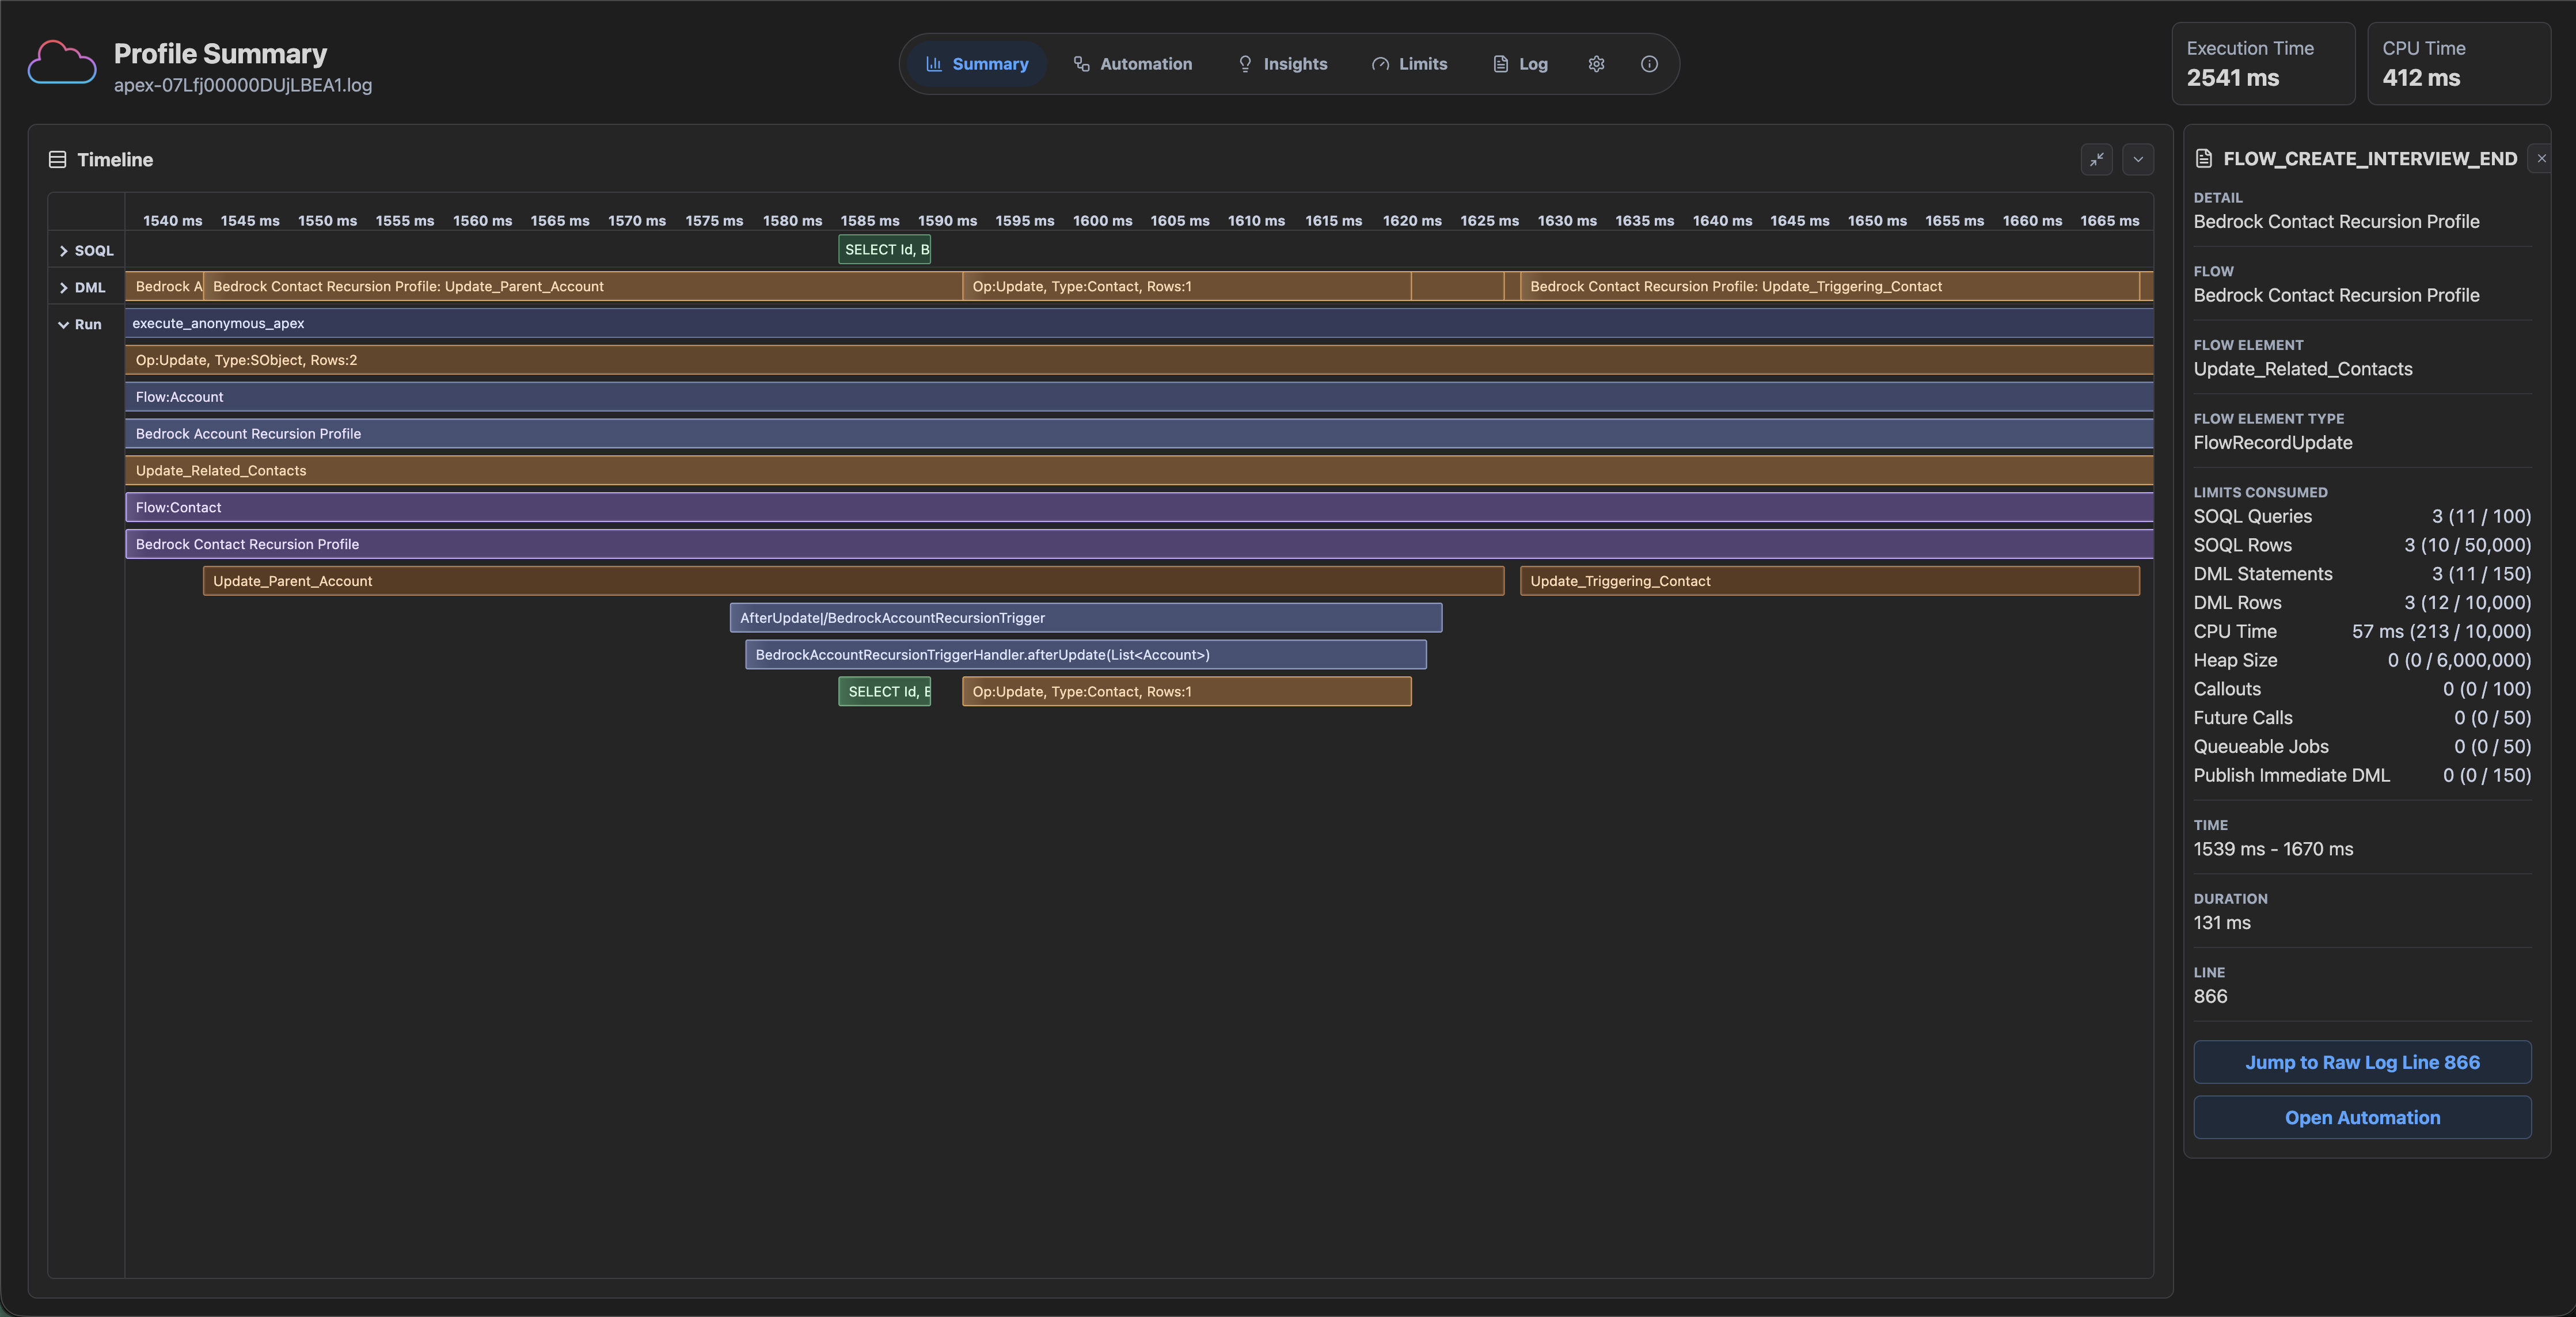
SF Profiler also follows your VS Code light or dark theme when the profile tab opens.
How To Use
- Open a Salesforce debug log in VS Code or select a
.logfile in Explorer. - Right-click the editor or the file.
- Choose Profile Log.
The profile opens in a normal editor tab.
License
SF Profiler is licensed under AGPL-3.0-or-later and includes a required attribution notice: Powered by SF Profiler.