Track your Claude Code AI costs in real-time directly in VSCode. Monitor daily and weekly spending, analyze model usage, and set cost alerts.
Screenshots
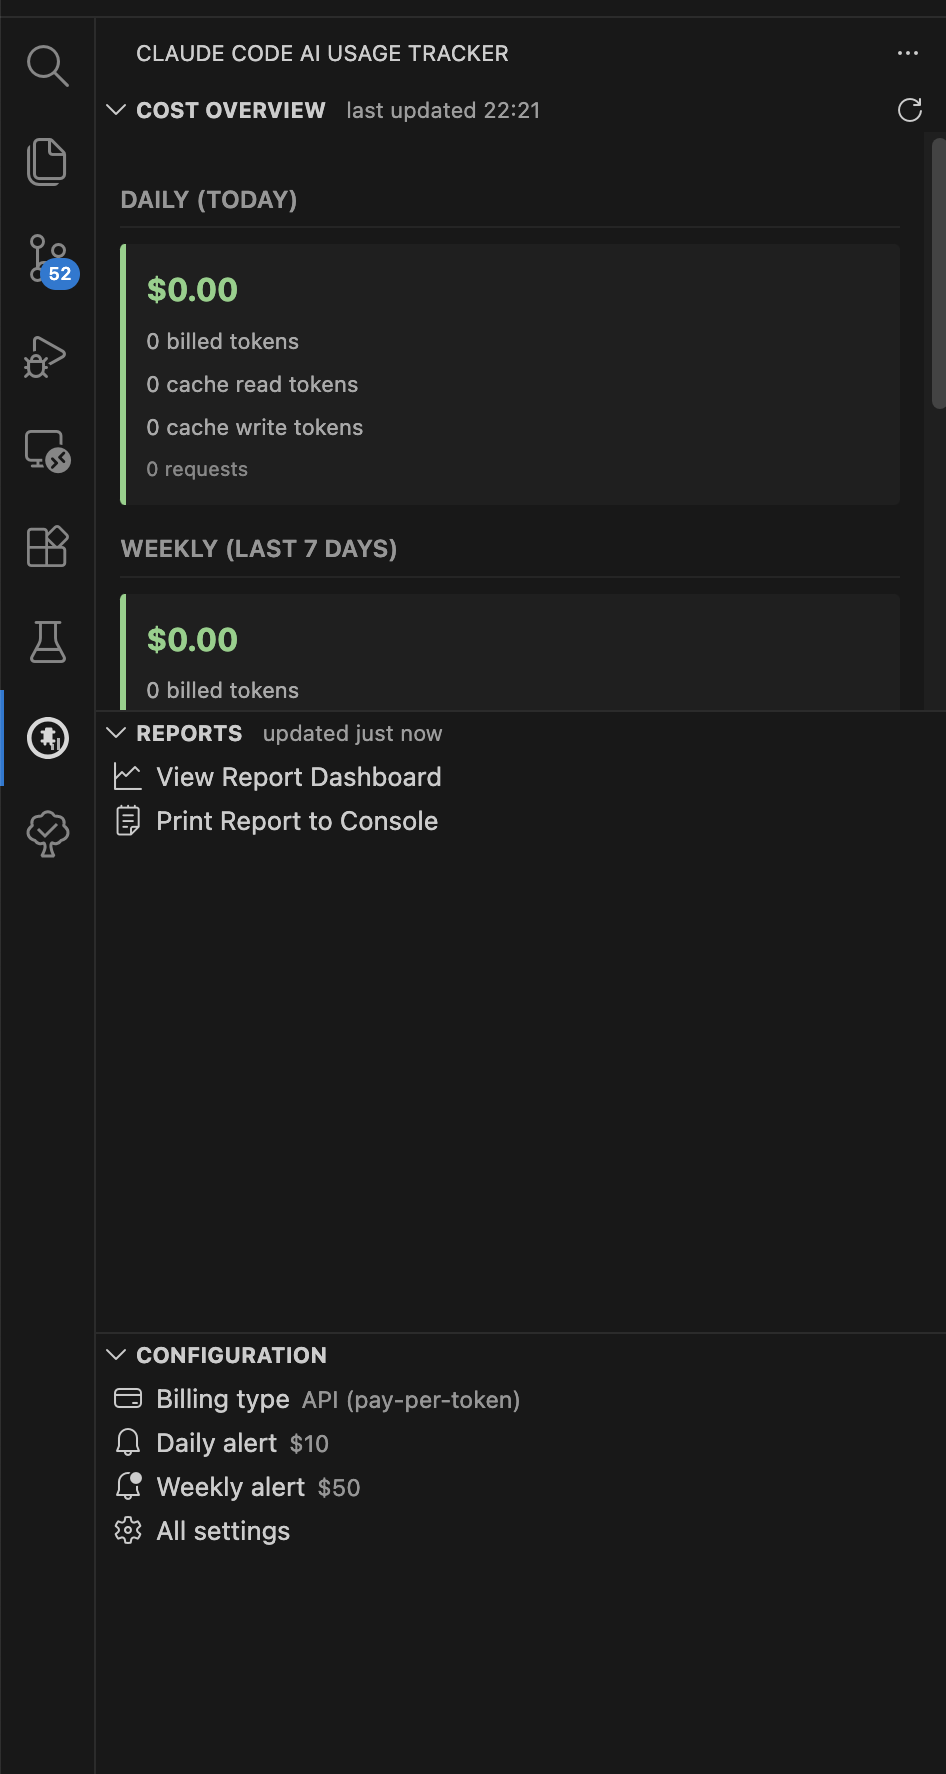
Sidebar — Cost Overview
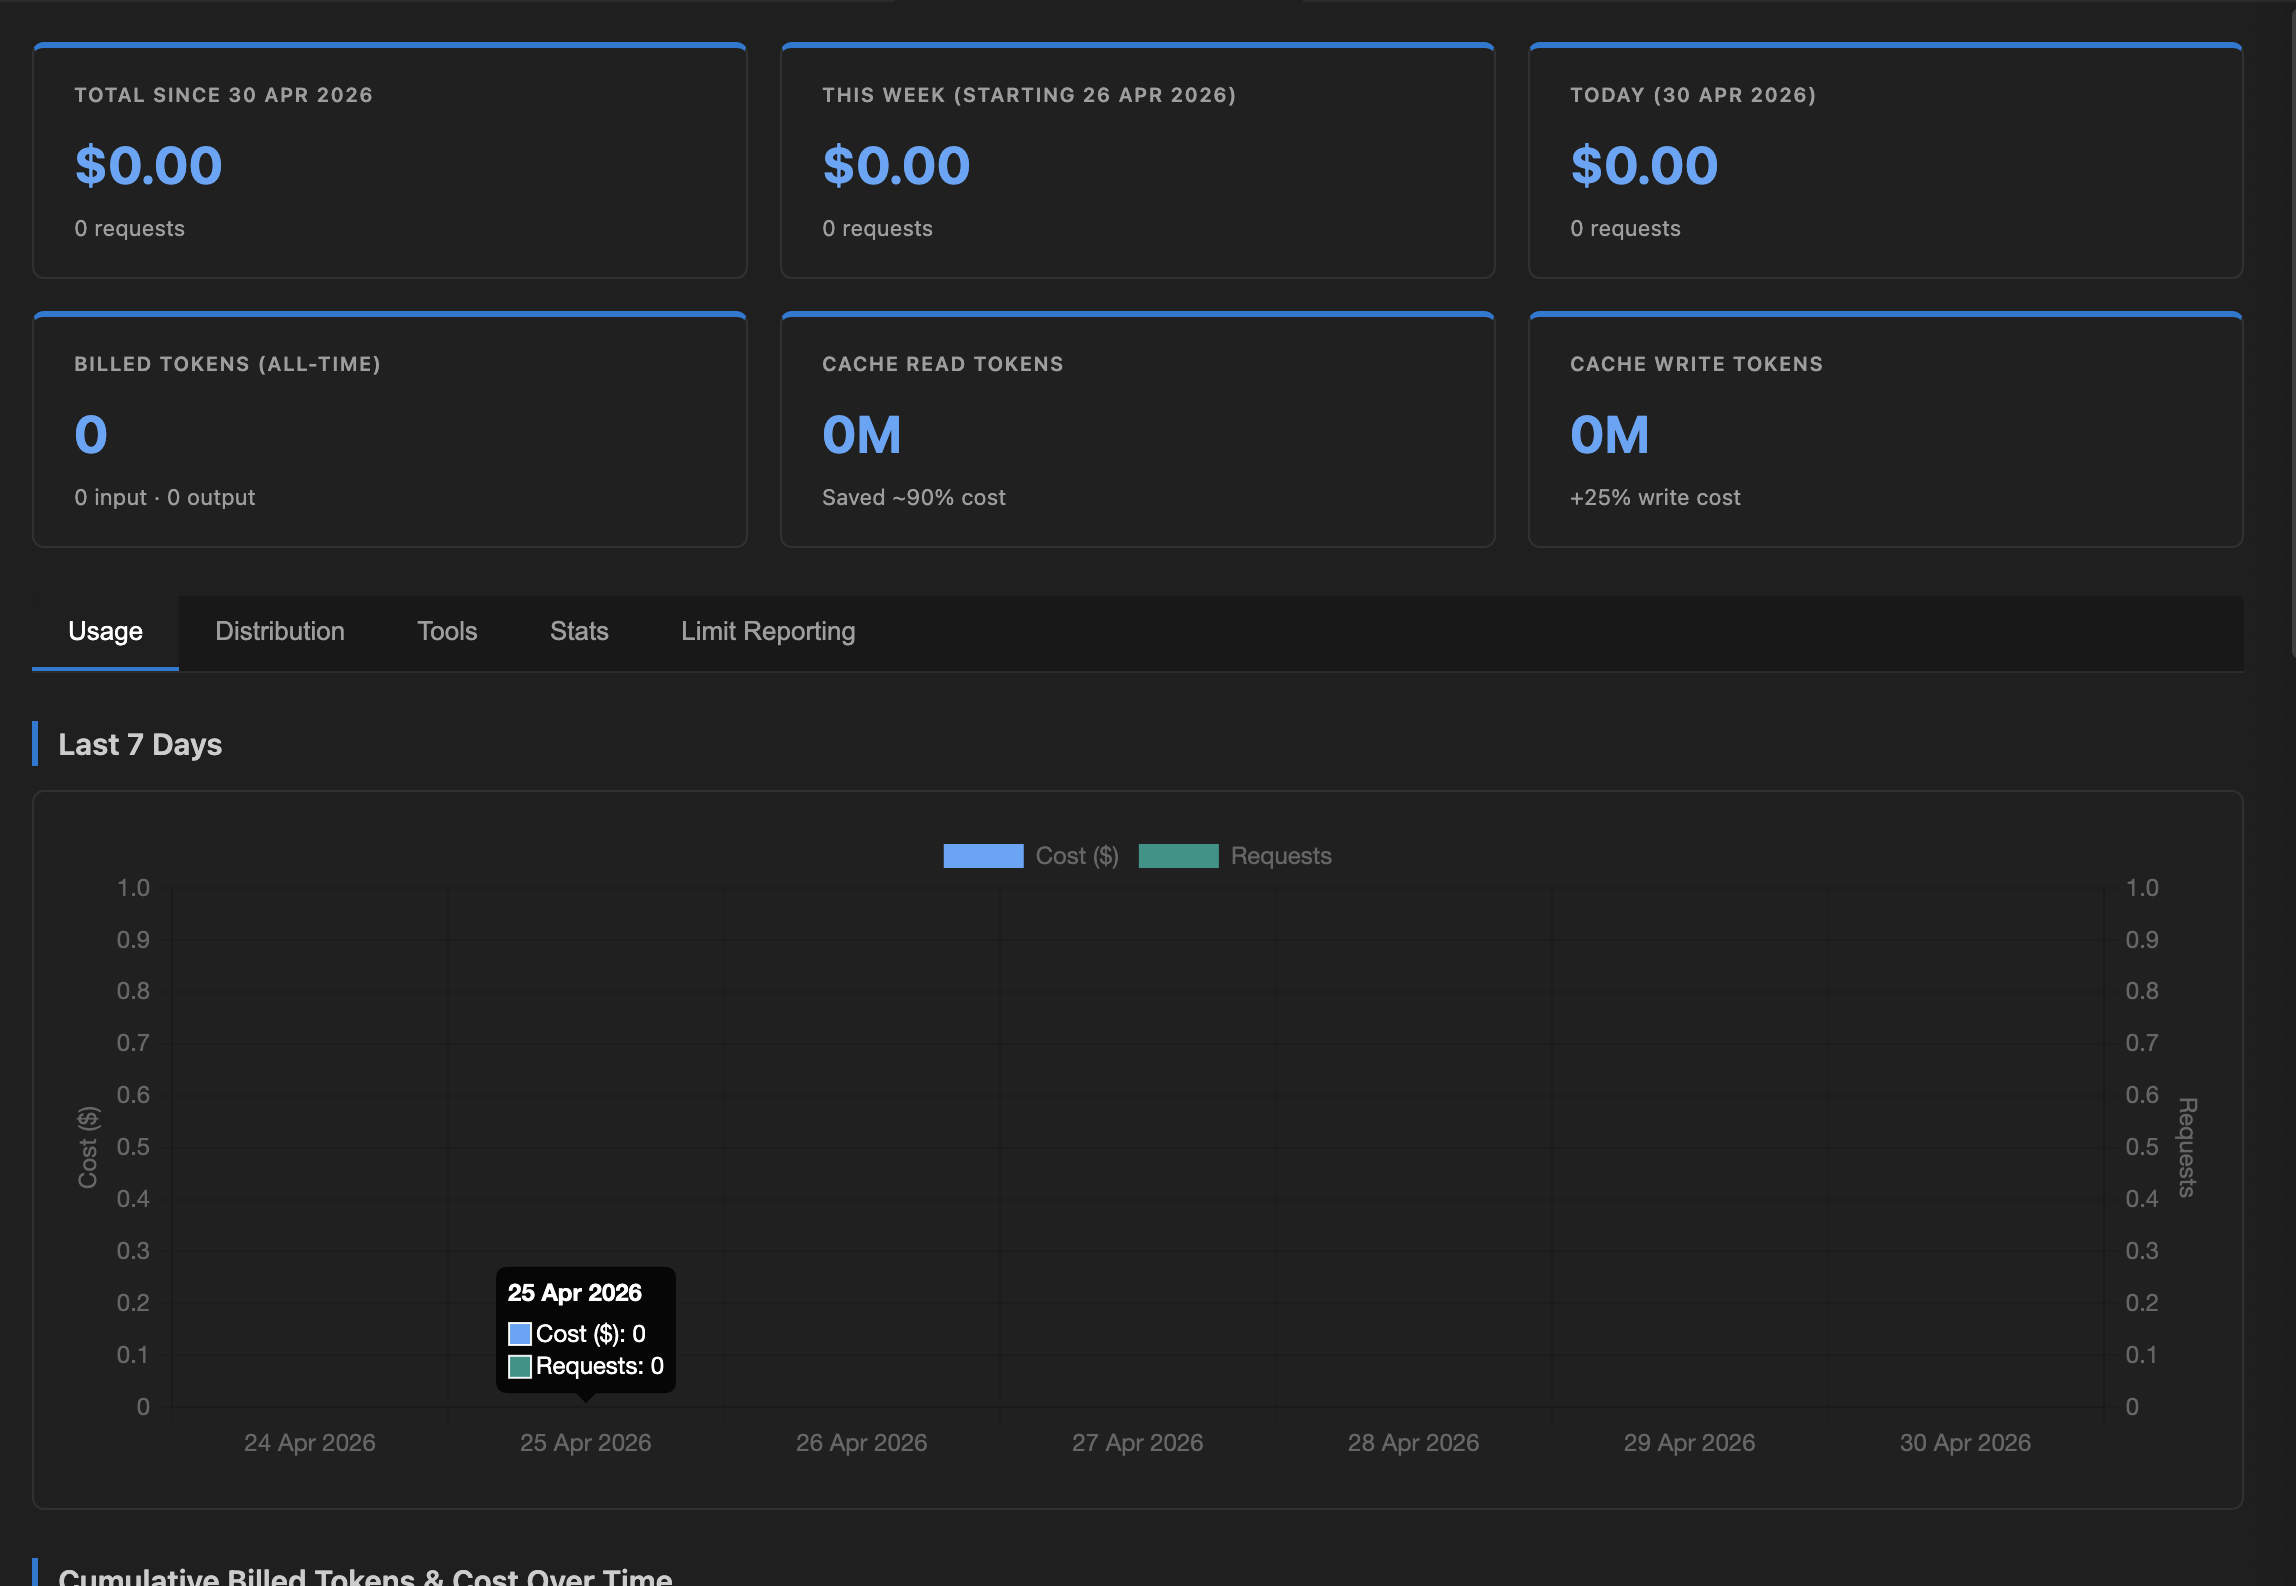
Reports Panel
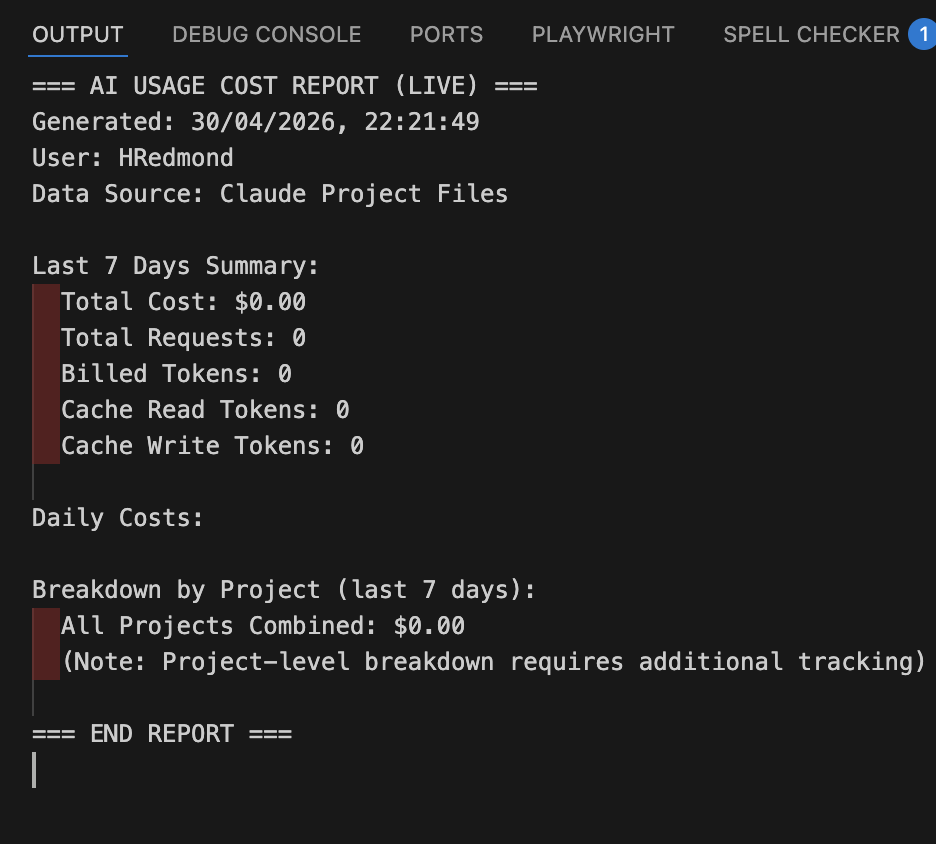
Console Report
Features
🎯 Real-Time Cost Tracking
- Live Usage Dashboard: Monitor today's costs and token usage in real-time
- Daily Breakdown: See daily costs with hourly detail and 7-day comparison
- Weekly Breakdown: Track weekly costs with customizable week start day (Monday or Sunday)
- Model Analytics: Analyze costs by Claude model (3.5 Haiku, 3.5 Sonnet, etc.)
- Project & Skills Tracking: View costs by project and Claude skills/tools used
🚨 Smart Alerts
- Daily Alert Threshold: Set a daily spending limit (e.g., $10)
- Weekly Alert Threshold: Set a weekly limit (e.g., $50)
- Visual Highlighting: Rows exceeding thresholds are highlighted in red (daily) and orange (weekly)
- Sortable Tables: Click column headers to sort by date, cost, or tokens
📊 Comprehensive Dashboard
- 5 Dashboard Tabs: Live Usage, Daily, Weekly, Models, Projects, Skills
- Real-Time Data: Data automatically synced from Claude's session files
- Historical Context: Aggregated statistics from
stats-cache.json - Token Breakdown: See input, output, cache read, and cache creation tokens separately
💾 Sidebar Integration
- Cost Overview: Quick view of today's cost, weekly cost, and all-time spend
- Reports Panel: Tree view with buttons to open Report Dashboard, Impact Dashboard, and print a console report — with a live countdown to the next auto-refresh
- Configuration Panel: Inline display of current alert thresholds and, when Impact Analysis is enabled, developer rate settings — all editable by clicking
- Impact Analysis Panel (opt-in): At-a-glance success rate, time saved, ROI, and helpfulness score read from
/insightsfacets data
🧠 Impact Analysis (opt-in)
- Session Success Rate: Percentage of Claude sessions rated as successful
- Time Saved Estimate: Estimated minutes saved based on session types and configurable baselines
- ROI Calculation: Developer value saved vs. API cost, expressed as a multiplier
- % Time Saved: Saved time as a percentage of contracted working hours
- Helpfulness Score: Average Claude helpfulness score across sessions
- Outcome & Type Charts: Bar charts breaking down session outcomes, types, and goal categories
- Friction Factors: Identify what's slowing Claude down
- Data Source: Reads facets JSON files from
~/.claude/usage-data/facets/generated by Claude Code's/insightsslash command
Quick Start (30 seconds)
- Install Extension → Clone repo, run
npm install && npm run compile - Press F5 → Launch Extension Development Host
- Open Sidebar → Click Claude AI usage costs icon (⚡) in left activity bar
- Click "📊 View Reports" → See full dashboard with all your costs
- Click "🔄 Refresh Costs" → Update data from latest Claude sessions
That's it! The sidebar now shows today's costs, and the dashboard shows detailed breakdowns by day, week, and model.
Installation
From Pre-Built VSIX (Quickest)
Pre-built VSIX files are available in the install/ folder:
- Download the latest
.vsixfile from theinstall/folder - In VS Code, open Command Palette (
Ctrl+Shift+P/Cmd+Shift+P) - Select
Extensions: Install from VSIX... - Choose the downloaded
.vsixfile - Reload VS Code
See install/README.md for details.
Build from Source
Quick Method (Build & Install):
npm run build-install
This automatically:
- Compiles the extension
- Cleans the
install/folder - Generates the VSIX package
- Copies it to
install/for distribution
Manual Method:
npm install
npm run compile
npm run package
Then manually copy the .vsix file to the install/ folder.
Testing
Test the Extension During Development
-
Prepare dependencies:
npm install -
Compile TypeScript:
npm run compile -
Launch the Extension Development Host:
- Press
F5in VS Code - This opens a new VS Code window running your extension in development mode
- Press
-
Test the Extension:
- In the development window, the sidebar should show "Claude AI usage costs"
- Click the ⚡ icon in the left activity bar to open the sidebar
- Click "📊 View Reports" to open the dashboard
- Click "🔄 Refresh Costs" to sync with Claude's data files
- Verify costs appear in the dashboard and sidebar
-
Use Claude to Generate Data:
- Use the Claude CLI:
claudecommand - This creates session files in
~/.claude/projects/ - Costs should appear in the extension dashboard
- Use the Claude CLI:
-
Debug:
- Set breakpoints in TypeScript files
- Open Developer Tools:
Help > Toggle Developer Tools - Check console output for errors and logs
Run Tests
npm test
Watch Mode (Auto-Compile)
npm run watch
While watch mode is running, code changes automatically recompile. Simply reload the extension window (Cmd+R / Ctrl+R) to test changes.
Configuration
The extension works automatically if Claude is installed, but you can customize it via VSCode settings:
Open Settings (JSON) and add:
{
  "aiUsageCost.dailyAlertThreshold": 10,
  "aiUsageCost.weeklyAlertThreshold": 50,
  "aiUsageCost.weekStartDay": "monday",
  "aiUsageCost.pollIntervalMinutes": 5,
  "aiUsageCost.showInsightsAnalysis": false,
  "aiUsageCost.developerHourlyRate": 50,
  "aiUsageCost.developerHoursPerWeek": 40,
  "aiUsageCost.billingType": "api",
  "aiUsageCost.customModelPricing": {}
}
Available Settings:
| Setting | Type | Default | Description |
|---|---|---|---|
aiUsageCost.dailyAlertThreshold |
number | 10 | Daily spending alert threshold in USD (0 to disable) |
aiUsageCost.weeklyAlertThreshold |
number | 50 | Weekly spending alert threshold in USD (0 to disable) |
aiUsageCost.weekStartDay |
string | "monday" | First day of the week for weekly breakdown (any day name) |
aiUsageCost.pollIntervalMinutes |
number | 5 | Auto-refresh interval in minutes (1 or more) |
aiUsageCost.showInsightsAnalysis |
boolean | false | Enable the Impact Analysis sidebar panel and Impact Dashboard |
aiUsageCost.developerHourlyRate |
number | 50 | Developer hourly rate used for ROI calculation in Impact Analysis |
aiUsageCost.developerHoursPerWeek |
number | 40 | Contracted weekly hours used to calculate % time saved in Impact Analysis |
aiUsageCost.billingType |
string | "api" | "api" (pay-per-token) or "max" (Claude Max subscription — costs shown are API-rate estimates) |
aiUsageCost.customModelPricing |
object | {} |
Override pricing for specific models (USD per 1M tokens) — see Configuring Pricing |
aiUsageCost.claudePath |
string | "claude" | Path to the Claude Code CLI binary |
aiUsageCost.statsCachePath |
string | "~/.claude/stats-cache.json" | Path to Claude's stats-cache.json for historical data import |
3. Enable the Sidebar & Status Bar
Show the Sidebar (Left Panel)
The sidebar shows your daily cost at a glance:
If sidebar is not visible:
- Look for the Claude AI usage costs icon in the left activity bar (⚡ icon)
- Click it to open the sidebar
- If you don't see the icon, the sidebar view may be disabled
To manually enable the sidebar:
- Open Command Palette (
Cmd+Shift+P/Ctrl+Shift+P) - Type:
AI Usage Cost: Focus on Sidebar - Press Enter
Or:
- Click View menu → Sidebar
- Look for "Claude AI usage costs" in the available views
- Click to enable
Show the Status Bar (Bottom Right)
A status bar item shows quick access to your costs:
If status bar is not visible:
- Look at the bottom-right corner of VSCode
- You should see your daily cost displayed (e.g., "$2.45")
- Click it to cycle through daily/weekly/monthly/all-time views
To toggle status bar visibility:
- Open Command Palette (
Cmd+Shift+P/Ctrl+Shift+P) - Type:
AI Usage Cost: Toggle Status Bar - Press Enter
4. View Your Dashboard
Open Command Palette (Cmd+Shift+P / Ctrl+Shift+P) and search for "AI Usage: Open Dashboard"
Or click the "📊 View Reports" button in the sidebar.
How It Works
Understanding the Cost Calculation
In Simple Terms:
- Every time you use Claude, it creates a
.jsonlsession file with how many tokens you used - The extension reads these files and multiplies token counts by Anthropic's prices
- Results are grouped by hour, day, week, and model for analysis
- The extension displays this data in your dashboard and sidebar
Example:
Claude session: 10,000 input tokens + 5,000 output tokens (using Haiku)
  ↓
  Calculate cost: (10,000 × $1/M) + (5,000 × $5/M) = $0.035
  ↓
  Add to today's total
  ↓
  Update sidebar: "Today: $2.45"
Data Sources
The extension reads from two data sources:
Live Data (.jsonl files)
- Located in:
~/.claude/projects/<project-name>/ - Contains: Session-by-session cost, tokens (input/output/cache), and metadata
- Updated: Every time you use Claude
- Used for: Live Usage, Daily, Weekly tabs
Historical Data (stats-cache.json)
- Located in:
~/.claude/stats-cache.json - Contains: Aggregated model usage, total costs, first session date
- Updated: Periodically by Claude
- Used for: Models tab, sidebar all-time cost
Data Calculation Pipeline
The extension uses a multi-stage pipeline to calculate costs from Claude's raw session data:
Stage 1: Session File Reading (generate-data.js)
~/.claude/projects/*/*.jsonl
         ↓
  Read all session files
  (one file per Claude session)
         ↓
  Extract from each session:
  ├─ Timestamps
  ├─ Model used (claude-opus-4-6, claude-sonnet-4-6, etc.)
  ├─ Input tokens
  ├─ Output tokens
  ├─ Cache read tokens
  └─ Cache write tokens
Stage 2: Cost Calculation per Session
For each session, calculate:
Input Cost = (input_tokens / 1M) × model_input_price
Output Cost = (output_tokens / 1M) × model_output_price
Cache Read Cost = (cache_read_tokens / 1M) × model_cache_read_price
Cache Write Cost = (cache_write_tokens / 1M) × model_cache_write_price

Total Session Cost = Input + Output + Cache Read + Cache Write
Stage 3: Aggregation by Time Period
Group all sessions by time period:
Hourly:   Group sessions by YYYY-MM-DDTHH (e.g., "2026-02-26T09")
          Filter to last 24 hours only
Daily:    Group sessions by YYYY-MM-DD (e.g., "2026-02-26")
Weekly:   Group sessions by ISO week (e.g., "2026-W08")
Monthly:  Group sessions by YYYY-MM (e.g., "2026-02")
For each period, sum:
- Total cost across all sessions
- Input, output, cache read, cache write tokens
- Session count (API calls)
Stage 4: Output to ai-stats-data.json
The aggregated data is saved to ai-stats-data.json with structure:
{
  "generated_at": "2026-02-26T10:09:55.921Z",
  "totals": {
    "input": 82658,
    "output": 23464,
    "cacheRead": 542936482,
    "cacheWrite": 35437312,
    "cost": 100.91,
    "count": 6336
  },
  "hourly": {
    "2026-02-26T09": { cost, count, input, output, cacheRead, cacheWrite },
    "2026-02-26T10": { cost, count, input, output, cacheRead, cacheWrite }
  },
  "daily": {
    "2026-02-26": { cost, count, input, output, cacheRead, cacheWrite }
  },
  "weekly": {
    "2026-W08": { cost, count, input, output, cacheRead, cacheWrite }
  },
  "projects": {
    "project-name": {
      "total": { cost, count, ... },
      "models": {
        "claude-opus-4-6": { cost, count, ... }
      }
    }
  }
}
Cost Pricing Model
Note on billing types: These rates apply to pay-per-token API users only. If you are on a Claude Max subscription ($100–$200/month flat fee), the token counts in your JSONL files are real but the dollar values shown are estimates at API rates, not your actual charges. Set
aiUsageCost.billingTypeto"max"to label all cost figures as estimates in the UI.
The extension uses official Anthropic pricing (updated Feb 2026):
| Model | Input | Output | Cache Read | Cache Write |
|---|---|---|---|---|
| Claude 3.5 Haiku | $1/M | $5/M | $0.10/M | $1.25/M |
| Claude 3.5 Sonnet | $3/M | $15/M | $0.30/M | $3.75/M |
| Claude Opus 4.6 | $5/M | $25/M | $0.50/M | $6.25/M |
Token Type Explanation:
- Input tokens: Text you send to Claude (cheaper, billed at lower rate)
- Output tokens: Text Claude generates (more expensive, ~5x input cost)
- Cache read tokens: Previously cached prompt reused (90% cheaper than fresh input!)
- Example: Reading 1M cached tokens costs $0.10 instead of $1.00
- Cache write tokens: Creating new cache (25% premium on top of output cost)
- Example: 1M tokens cached costs $1.25 instead of $1.00, but saves money on future reads
Example Cost Calculation (Haiku):
Session with:
- 10,000 input tokens
- 5,000 output tokens
- 50,000 cache read tokens

Input cost:     (10,000 / 1,000,000) × $1.00   = $0.01
Output cost:    (5,000 / 1,000,000) × $5.00    = $0.025
Cache read cost: (50,000 / 1,000,000) × $0.10  = $0.005
───────────────────────────────────────────────────
Total:                                          = $0.04 per session
Base rates are defined in src/utils/pricing.ts. See Configuring Pricing to override them.
Configuring Pricing
If Anthropic changes their pricing, you have a negotiated rate, or you want to zero out costs (e.g. on a Max plan), you can override any model's rates without editing code.
Set billing type — shown in the Configuration sidebar panel and used to label cost figures:
{ "aiUsageCost.billingType": "max" }
Override specific model rates — keys can be exact model names or partial substrings:
{
  "aiUsageCost.customModelPricing": {
    "haiku": {
      "inputPerMillion": 0.8,
      "outputPerMillion": 4.0,
      "cacheReadPerMillion": 0.08,
      "cacheWritePerMillion": 1.0
    },
    "claude-sonnet-4-6": {
      "inputPerMillion": 3,
      "outputPerMillion": 15
    }
  }
}
You only need to specify the fields you want to change — anything omitted falls back to the built-in rate. Overrides apply immediately on save and are used by both the live extension and the background data generation script.
You can also change billing type interactively via the Command Palette: Claude Code: Set Billing Type.
Usage
Viewing Your Dashboard
Method 1: Command Palette
- Press
Cmd+Shift+P(Mac) orCtrl+Shift+P(Linux/Windows) - Type "AI Usage: Show Dashboard"
- Press Enter
Method 2: Sidebar Button
- Look for the "Dashboard" button in the AI Usage sidebar
- Click to open dashboard
Dashboard Tabs
⚡ Live Usage
- Today's Cost: Total spent today
- Token Summary: Billed, cache read, and cache write tokens
- Today's Projects: Which projects used Claude today
- Hourly Breakdown: Cost by hour of day
- Daily Comparison: Last 7 days at a glance
📅 Daily Breakdown
- Sortable Table: Date, cost, tokens
- Alert Highlighting: Red rows where daily cost ≥ threshold
- Visual Bar Chart: Relative costs across days
- Click to Sort: Header columns are sortable
📊 Weekly Breakdown
- Week Starting Date: Shows each week's start date
- Weekly Totals: Cost and tokens per week
- Alert Highlighting: Orange rows where weekly cost ≥ threshold
- Configurable Weeks: Adjust week start day in settings
🤖 Models
- By Model: Cost breakdown for each Claude model used
- Historical Data: From stats-cache.json (aggregate across all sessions)
- Usage Trend: Which models you use most
📁 Projects
- By Project: Cost per project folder
- Session Details: Individual session records
- Project Breakdown: Total tokens and cost per project
🛠️ Skills & Tools
- Skills Usage: Which Claude skills you used today
- Tools Used: External tools called by Claude
🧠 Impact Dashboard (requires showInsightsAnalysis: true)
- Summary Cards: Session count, success rate, time saved, ROI multiplier, % time saved, avg helpfulness, dev value saved, and total API cost
- Outcome Distribution: Bar chart of session outcomes (successful, partial, failed, etc.)
- Session Type Distribution: Bar chart of session types (feature, debug, refactor, etc.)
- Goal Category Distribution: Bar chart of goal categories
- Helpfulness Distribution: Breakdown of helpfulness ratings across sessions
- Friction Factors: Common factors that reduced Claude's effectiveness
- Data: Read from
~/.claude/usage-data/facets/*.json(generated by/insightsin Claude Code)
Updating & Refreshing Data
The extension automatically updates data as you use Claude, but you can manually refresh to see the latest costs:
Sidebar Refresh
- Open the AI Usage Cost sidebar (left panel)
- Click the 🔄 Refresh Costs button
- Extension will:
- Scan
~/.claude/projects/*/for the latest session files - Regenerate cost calculations from all sessions
- Update the sidebar display with fresh data
- Complete in 1-3 seconds depending on session history
- Scan
Charts Panel Refresh
- Open the Charts panel (📊 View Charts button)
- Click the 🔄 Refresh button in the top-right
- Extension will:
- Re-run data generation from Claude project files
- Regenerate all charts with the latest data
- Update hourly distribution (last 24 hours)
- Refresh all metrics
Automatic Updates
The extension also automatically refreshes data:
- When the extension first loads
- Every 5 minutes (configurable via
pollIntervalMinutessetting) - When you switch back to VSCode window
- When you open the dashboard or charts
Note: Data accuracy depends on how often Claude writes to ~/.claude/projects/*/ session files. Most sessions are logged in real-time, so updates appear immediately.
Auto-Poll Interval
The extension automatically refreshes every pollIntervalMinutes (default: 5 minutes). The Reports sidebar panel shows a countdown to the next refresh. To change the interval:
- Open Settings and search "aiUsageCost.pollIntervalMinutes"
- Set the value in minutes (minimum: 1)
Setting Alerts
Open VSCode Settings:
- Press
Cmd+,(Mac) orCtrl+,(Linux/Windows) - Search for "aiUsageCost"
- Adjust
dailyAlertThresholdandweeklyAlertThreshold
Example:
- Set
dailyAlertThresholdto5to alert if daily cost ≥ $5 - Set
weeklyAlertThresholdto25to alert if weekly cost ≥ $25 - Set
weekStartDayto"sunday"to use Sunday-based weeks
Alert row colors:
- 🔴 Red: Daily cost exceeded threshold
- 🟠 Orange: Weekly cost exceeded threshold
Prerequisites
- VSCode: 1.60.0 or higher
- macOS / Linux / Windows: Any platform that VSCode supports
- Claude: Installed and used (creates
~/.claude/directory)
The extension automatically detects your Claude installation and reads from the standard Claude data files.
Troubleshooting
❌ "No data showing in dashboard"
Cause: No Claude sessions have been captured yet.
Solution:
- Use Claude through the terminal or the Claude IDE
- Wait a moment for data to sync
- Reload the dashboard (
Cmd+Shift+P→ "Developer: Reload Window")
❌ "Dashboard shows very low costs"
Cause: Alert thresholds in settings might be set too high.
Solution:
- Check your configuration: Open settings and search "aiUsageCost"
- Verify
dailyAlertThresholdandweeklyAlertThresholdare reasonable - Check that Claude CLI is installed:
which claude
❌ "Tables not sorting"
Solution:
- Reload VSCode window:
Cmd+Shift+P→ "Developer: Reload Window" - Close and reopen the dashboard
❌ "Sidebar not showing cost"
Cause: Stats-cache.json file not found or formatted incorrectly.
Solution:
- Verify Claude has been used:
ls ~/.claude/stats-cache.json - Ensure you've used Claude through the CLI
- Reload the extension window
Development & Architecture
Project Structure
vscode-extension-claude-code-ai-tracker/
├── src/
│   ├── extension.ts                  # Main extension entry point & command registration
│   ├── types.ts                      # TypeScript interfaces (CostRecord, etc.)
│   ├── services/
│   │   ├── aiStatsDataService.ts     # Reads & aggregates ai-stats-data.json
│   │   ├── claudeCapture.ts          # Session data capture from .jsonl
│   │   ├── claudeProjectsService.ts  # Project data aggregation
│   │   ├── claudeStatsService.ts     # Stats-cache.json parsing
│   │   ├── facetsService.ts          # Impact Analysis: reads ~/.claude/usage-data/facets/
│   │   ├── gitService.ts             # Git branch & project name
│   │   ├── jsonlCostService.ts       # .jsonl file parsing & session cost index
│   │   ├── statsCacheService.ts      # Historical data import
│   │   ├── storageService.ts         # VSCode globalState wrapper
│   │   └── __tests__/               # Jest unit tests for all services
│   ├── utils/
│   │   ├── pricing.ts                # Model pricing constants & cost calculation
│   │   ├── webviewHelpers.ts         # Nonce generation, URI helpers
│   │   └── __tests__/               # Tests for utils
│   ├── views/
│   │   ├── chartsPanel.ts            # Charts webview panel
│   │   ├── dashboardPanel.ts         # Main dashboard webview panel
│   │   ├── impactDashboardPanel.ts   # Impact Analysis full dashboard
│   │   ├── impactSidebarProvider.ts  # Impact Analysis sidebar webview
│   │   ├── reportDashboardPanel.ts   # Report/export webview panel
│   │   ├── sidebarProvider.ts        # Cost Overview sidebar webview
│   │   └── treeProviders.ts          # Reports & Configuration tree views
│   └── webview/
│       └── costHistory.html          # Cost history HTML template
├── media/
│   ├── chart.min.js                  # Bundled Chart.js
│   ├── icon.svg                      # Activity bar icon
│   └── webview.css                   # Shared webview stylesheet
├── generate-data.js                  # Node.js script: parses JSONL → ai-stats-data.json
├── ai-stats-data.json               # Generated data file (gitignored)
├── package.json
├── tsconfig.json
└── README.md
Build & Development
Build the extension:
npm run compile     # One-time build
npm run watch       # Watch mode (auto-recompile)
Debug the extension:
- Press
F5to launch Extension Development Host - Set breakpoints in TypeScript files
- Open Developer Tools: Help → Toggle Developer Tools
- Run commands in the test window
Rebuild after changes:
- Watch mode automatically recompiles (
npm run watch) - Reload window:
Cmd+Shift+P→ "Developer: Reload Window"
Data Flow Architecture
┌───────────────────────────────────────────────────────┐
│        ~/.claude/ (Claude's local data)               │
│  ├─ projects/                                         │
│  │  ├─ project-a/                                     │
│  │  │  └─ *.jsonl (session-by-session records)        │
│  │  └─ project-b/                                     │
│  │     └─ *.jsonl (session-by-session records)        │
│  └─ stats-cache.json (model aggregates)               │
└────────────────┬────────────────────────────────────┘
                 │
                 ▼
    generate-data.js (Node.js Script)
    ┌─────────────────────────────────┐
    │ 1. Read all .jsonl files        │
    │ 2. Parse session data           │
    │ 3. Calculate cost per session   │
    │ 4. Aggregate by time period:    │
    │    ├─ Hourly (last 24h)         │
    │    ├─ Daily                     │
    │    ├─ Weekly                    │
    │    ├─ Monthly                   │
    │    └─ By model/project          │
    │ 5. Write ai-stats-data.json     │
    └────────────┬────────────────────┘
                 │
                 ▼
    ai-stats-data.json (Generated)
    ├─ totals: { cost, input, output, tokens }
    ├─ hourly: { "2026-02-26T09": {...} }
    ├─ daily: { "2026-02-26": {...} }
    ├─ weekly: { "2026-W08": {...} }
    └─ projects: { "name": {...} }
                 │
    ┌────────────┴────────────────────┐
    ▼                                  ▼
Sidebar Provider              Charts Panel
(Quick View)                 (Full Analysis)
├─ Today's cost              ├─ Live Usage Tab
├─ This week's cost          ├─ Token & API Value
├─ All-time cost             ├─ Activity Tab
└─ Refresh button            ├─ Projects Tab
                             └─ Sessions Tab
When you click "🔄 Refresh Costs":
- Extension runs
generate-data.js - Script scans all session files in
~/.claude/projects/*/ - Calculates costs and aggregates by time period
- Writes updated
ai-stats-data.json - UI automatically reads new data and updates display
Key Services
JsonlCostService (src/services/jsonlCostService.ts)
- Reads session
.jsonlfiles from~/.claude/projects/*/ - Parses token counts and costs per session
- Used for real-time live usage tracking
ClaudeProjectsService (src/services/claudeProjectsService.ts)
- Aggregates daily and weekly costs from .jsonl data
- Groups by date and week
- Feeds data into Daily/Weekly tabs
ClaudeStatsService (src/services/claudeStatsService.ts)
- Reads historical
stats-cache.json - Extracts model-level cost breakdown
- Provides all-time cost and first session date
PricingService (src/utils/pricing.ts)
- Calculates USD cost from token counts
- Uses model-specific rates
- Handles cache read/creation token premiums
FacetsService (src/services/facetsService.ts)
- Reads JSON facets files from
~/.claude/usage-data/facets/ - Calculates session success rate, time saved, ROI, and helpfulness metrics
- Uses configurable per-session-type time baselines (
sessionTimeBaselinessetting) - Powers both the Impact Sidebar and Impact Dashboard
ReportsTreeProvider / ConfigSettingsTreeProvider (src/views/treeProviders.ts)
- Tree view providers for the Reports and Configuration sidebar panels
- Reports panel: links to dashboards with a live countdown to next auto-refresh
- Config panel: shows and allows editing alert thresholds and developer rate settings
ImpactSidebarProvider (src/views/impactSidebarProvider.ts)
- Webview sidebar for the Impact Analysis panel (shown when
showInsightsAnalysisis enabled) - Displays at-a-glance impact metrics and links to the full Impact Dashboard
ImpactDashboardPanel (src/views/impactDashboardPanel.ts)
- Full webview panel with impact charts (outcome distribution, session types, helpfulness, friction)
- Opens via command palette or the Reports tree view
Extending the Extension
Adding a New Dashboard Tab
- Add tab button in
dashboardPanel.tsgetHtml() method - Create HTML tab content
- Add CSS styling in
<style>block - Add JavaScript handler for tab switching
- Recompile and test
Updating Model Pricing
Edit src/utils/pricing.ts:
const CLAUDE_PRICING = {
  'claude-3-5-haiku': {
    input: 0.80 / 1_000_000,
    output: 4.00 / 1_000_000,
    cacheRead: 0.10 / 1_000_000,
    cacheCreation: 5.00 / 1_000_000,
  },
  // Add or update models here
};
Adding Alert Thresholds for Other Metrics
Currently supports daily/weekly cost thresholds. To add token-based thresholds:
- Add new setting in package.json configuration
- Read setting in
dashboardPanel.tsgetHtml() - Pass to JavaScript via template variable
- Add comparison logic in
checkAndDisplayAlerts() - Update CSS for new alert class
Features
Core Capabilities
✅ Automatic Cost Tracking: No manual commands needed — reads live Claude data
✅ Auto-Refresh: Configurable polling every N minutes with countdown in the sidebar
✅ Multi-Tab Dashboard: Live Usage, Daily, Weekly, Models, Projects, Skills
✅ Smart Alerts: Highlight rows exceeding your daily/weekly cost thresholds
✅ Token Analysis: Detailed breakdown of input/output/cache read/cache write tokens
✅ Historical View: Aggregate statistics from stats-cache.json
✅ Sortable Tables: Click headers to sort by date, cost, or tokens
✅ Model Analytics: See which Claude models you use most
✅ Sidebar Panels: Cost Overview, Reports, Configuration, and Impact Analysis
✅ Status Bar: Quick cost view at the bottom of VS Code with cycling modes
✅ Impact Analysis (opt-in): ROI, time saved, success rates from /insights facets data
Impact Analysis (opt-in)
Enable by setting aiUsageCost.showInsightsAnalysis: true.
Requires running /insights in Claude Code, which generates session facets JSON files at ~/.claude/usage-data/facets/. Once enabled:
- The Impact Analysis panel appears in the sidebar
- The Reports tree view gains an "View Impact Dashboard" button
- The full Impact Dashboard is accessible via command palette
Example ROI calculation:
Sessions: 10 (8 successful)
Time baselines: feature_implementation=60min, debugging=30min
Estimated time saved: 8 × avg(60, 30) = 360 minutes
Dev value saved: (360/60) × $50/hr = $300
API cost: $2.50
ROI: 300 / 2.50 = 120× return
Not Included (Removed Features)
These features from earlier versions are no longer needed:
- ❌ Manual "Capture Cost" commands (now automatic)
- ❌ Per-branch tracking (focused on overall cost tracking)
- ❌ VSCode Memento storage (uses Claude's native files)
FAQ
Q: Does the extension capture costs automatically?
A: Yes! The extension automatically reads from Claude's session files. No manual commands needed.
Q: What data sources does it use?
A: Two sources:
- Live sessions (
~/.claude/projects/*.jsonl) - Real-time session data - Historical stats (
~/.claude/stats-cache.json) - Aggregate statistics
Q: Can I export the data?
A: The dashboard shows all costs in real-time. You can:
- Take screenshots of the dashboard
- Copy tables from the dashboard
- Note the displayed totals manually
Future versions may add direct CSV/JSON export.
Q: What if I haven't used Claude yet?
A: The .claude/ folder and files are created automatically when you first use the Claude CLI. The extension will show "No data" until then.
Q: Can I reset the costs?
A: Costs come from Claude's official data files. To start fresh:
- Delete or rename
~/.claude/folder - Use Claude again to create new files
- Restart VSCode
Q: Why isn't my alert highlighting working?
A: Check your settings:
{
  "aiUsageCost.dailyAlertThreshold": 10,
  "aiUsageCost.weeklyAlertThreshold": 50
}
Set thresholds to reasonable values for your usage patterns.
Q: How often does the data update?
A: The extension auto-refreshes at a configurable interval (default: every 5 minutes, controlled by aiUsageCost.pollIntervalMinutes). The Reports sidebar panel shows a live countdown to the next scheduled refresh. You can also trigger a manual refresh at any time via the 🔄 button in the Cost Overview sidebar or the Claude Code: Refresh Data command.
Available Commands
All commands are accessible via Command Palette (Cmd+Shift+P / Ctrl+Shift+P):
| Command | Description |
|---|---|
| Claude Code: Open Dashboard | Open the full Live Usage / Daily / Weekly / Models / Projects dashboard |
| Claude Code: Open Charts | Open the charts panel with advanced visualizations |
| Claude Code: Open Report Dashboard | Open the detailed report/export dashboard |
| Claude Code: Open Impact Dashboard | Open the Impact Analysis dashboard (requires showInsightsAnalysis: true) |
| Claude Code: Refresh Data | Manually refresh cost data from Claude's session files |
| Claude Code: Capture Cost Now | Manually trigger cost data capture (usually automatic) |
| Claude Code: Show Cost History | Display cost history in output channel |
| Claude Code: Import Historical Data from Cache | Import costs from stats-cache.json into extension storage |
| Claude Code: Clear All Data | Clear all stored cost data (caution: cannot undo) |
| Claude Code: Print Report to Console | Print a text summary to the Output panel |
| Claude Code: Edit Daily Alert Threshold | Set daily cost alert threshold interactively |
| Claude Code: Edit Weekly Alert Threshold | Set weekly cost alert threshold interactively |
| Claude Code: Edit Developer Hourly Rate | Set developer hourly rate for ROI calculation |
| Claude Code: Edit Developer Hours Per Week | Set contracted weekly hours for % time saved calculation |
| Claude Code: Set Billing Type | Switch between api (pay-per-token) and max (subscription estimate) billing labels |
| AI Usage Cost: Toggle Status Bar | Show/hide cost display in status bar (bottom-right) |
| AI Usage Cost: Cycle Status Bar Mode | Toggle status bar between daily/weekly/monthly/all-time views |
Keyboard Shortcuts
| Action | Shortcut | Alternative |
|---|---|---|
| Open Command Palette | Cmd+Shift+P |
Ctrl+Shift+P (Linux/Windows) |
| Show Dashboard | Search "AI Usage: Open Dashboard" in palette | |
| Show Charts | Search "AI Usage: Open Charts" in palette | |
| Developer Tools | Cmd+Option+I |
Ctrl+Shift+I (Linux/Windows) |
| Reload Window | Search "Developer: Reload Window" in palette |
License
MIT License - See LICENSE file for details.
Contributing
Contributions welcome! Areas to help:
- Bugs: Report issues on GitHub
- Features: Suggest new dashboard views or metrics
- Documentation: Improve this README
- Testing: Test across different OSes
- Code: Submit PRs for improvements
Development Setup
git clone <your-fork-url>
cd ai-usage-cost-vscode-extension
npm install
npm run watch     # Auto-compile on changes
f5                # Launch Extension Development Host
Support
- Issues: GitHub Issues for bugs and feature requests
- Documentation: This README and inline code comments
- Community: Fork and extend as needed
Track your Claude costs efficiently! 📊💰