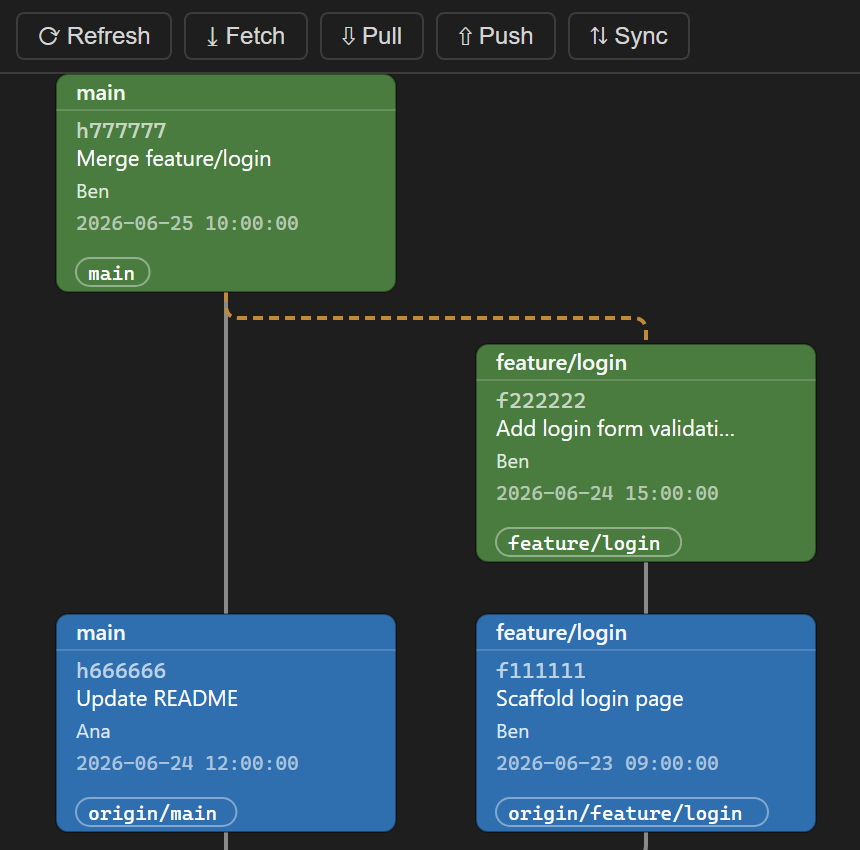
A TortoiseSVN-style revision graph for Git inside VS Code. Commits, local & remote branches, and tags are displayed as connected, color-coded boxes.
▶ Try the live demo in your browser — no install required; runs the real renderer on a sample repository.
How to open
Open a folder or workspace that contains a Git repository, then either:
- Open the Command Palette (
Ctrl+Shift+P) and run "Git Revision Graph: Open Revision Graph", or - Click the graph icon in the Source Control title bar (top-right of the SCM panel), or
- Use the keyboard shortcut
Ctrl+Alt+G.
Features
- DAG layout — commits arranged in columns per branch with connecting lines.
- Color-coded nodes — HEAD/current branch (red), local branches (green), remote branches (blue), tags (yellow), plain commits (grey).
- Right-click a commit → "Create branch from here…" — creates a new branch at that commit using VS Code's built-in Git, then refreshes the graph.
- Checkout a commit directly from the graph.
- Copy SHA of any commit.
- Zoom & pan the graph canvas.
Settings
| Setting | Default | Description |
|---|---|---|
revGraph.maxCommits |
1000 |
Maximum number of commits to load into the graph. |
Other hosts
Also available for Visual Studio 2022 / 2026 and JetBrains IDEs (IntelliJ IDEA, Android Studio, DevEco Studio, WebStorm, PyCharm, GoLand, etc.).
Source code & license
- Source code: https://github.com/HunKonTech/git_Revision_Graph
- License: Business Source License 1.1 — free for personal, internal, and non-commercial use. Selling, reselling, or offering the software as a paid product or service is not permitted. Converts to MPL 2.0 four years after each version's release.
Git Revision Graph (Magyar)
Egy TortoiseSVN-stílusú revíziógraf Git-hez VS Code-on belül. A commitok, helyi és távoli ágak, valamint tagek összekötött, színkódolt dobozokként jelennek meg.
▶ Próbáld ki az élő demót a böngésződben — telepítés nélkül; a valódi megjelenítő fut egy minta-repozitóriummal.
Megnyitás
Nyiss meg egy mappát vagy munkaterületet, amely egy Git repozitóriumot tartalmaz, majd:
- Nyisd meg a Parancspalettát (
Ctrl+Shift+P) és futtasd a "Git Revision Graph: Open Revision Graph" parancsot, vagy - Kattints a gráf ikonra a Forráskezelő panel fejlécében (jobb felső sarok), vagy
- Használd a
Ctrl+Alt+Gbillentyűparancsot.
Funkciók
- DAG elrendezés — a commitok áganként oszlopokba rendezve, összekötő vonalakkal.
- Színkódolt csomópontok — HEAD/aktuális ág (piros), helyi ágak (zöld), távoli ágak (kék), tagek (sárga), sima commitok (szürke).
- Jobb klikk egy commitra → "Ág létrehozása innen…" — új ágat hoz létre az adott committól a VS Code beépített Git-jén keresztül, majd frissíti a gráfot.
- Checkout — commit közvetlen kivétele a gráfból.
- SHA másolása bármely commithoz.
- Nagyítás és mozgatás a gráf felületén.
Beállítások
| Beállítás | Alapértelmezett | Leírás |
|---|---|---|
revGraph.maxCommits |
1000 |
A gráfba betöltendő commitok maximális száma. |
Más hosztokon
Elérhető Visual Studio 2022 / 2026-höz és JetBrains IDE-khez is (IntelliJ IDEA, Android Studio, DevEco Studio, WebStorm, PyCharm, GoLand, stb.).
Forráskód és licenc
- Forráskód: https://github.com/HunKonTech/git_Revision_Graph
- Licenc: Business Source License 1.1 — személyes, belső és nem-kereskedelmi célú használatra ingyenes. A szoftver eladása, továbbértékesítése, vagy fizetős termékként/szolgáltatásként történő kínálása nem megengedett. Verziónként a megjelenéstől számított négy év után MPL 2.0 licencre vált.