Find where your SQL result went wrong.
SQL Visual Debugger turns supported SELECT and WITH queries into a step-by-step visual debugger inside VS Code. Instead of only seeing the final result, you can inspect how rows are filtered, joined, grouped, changed, or removed through the query pipeline.
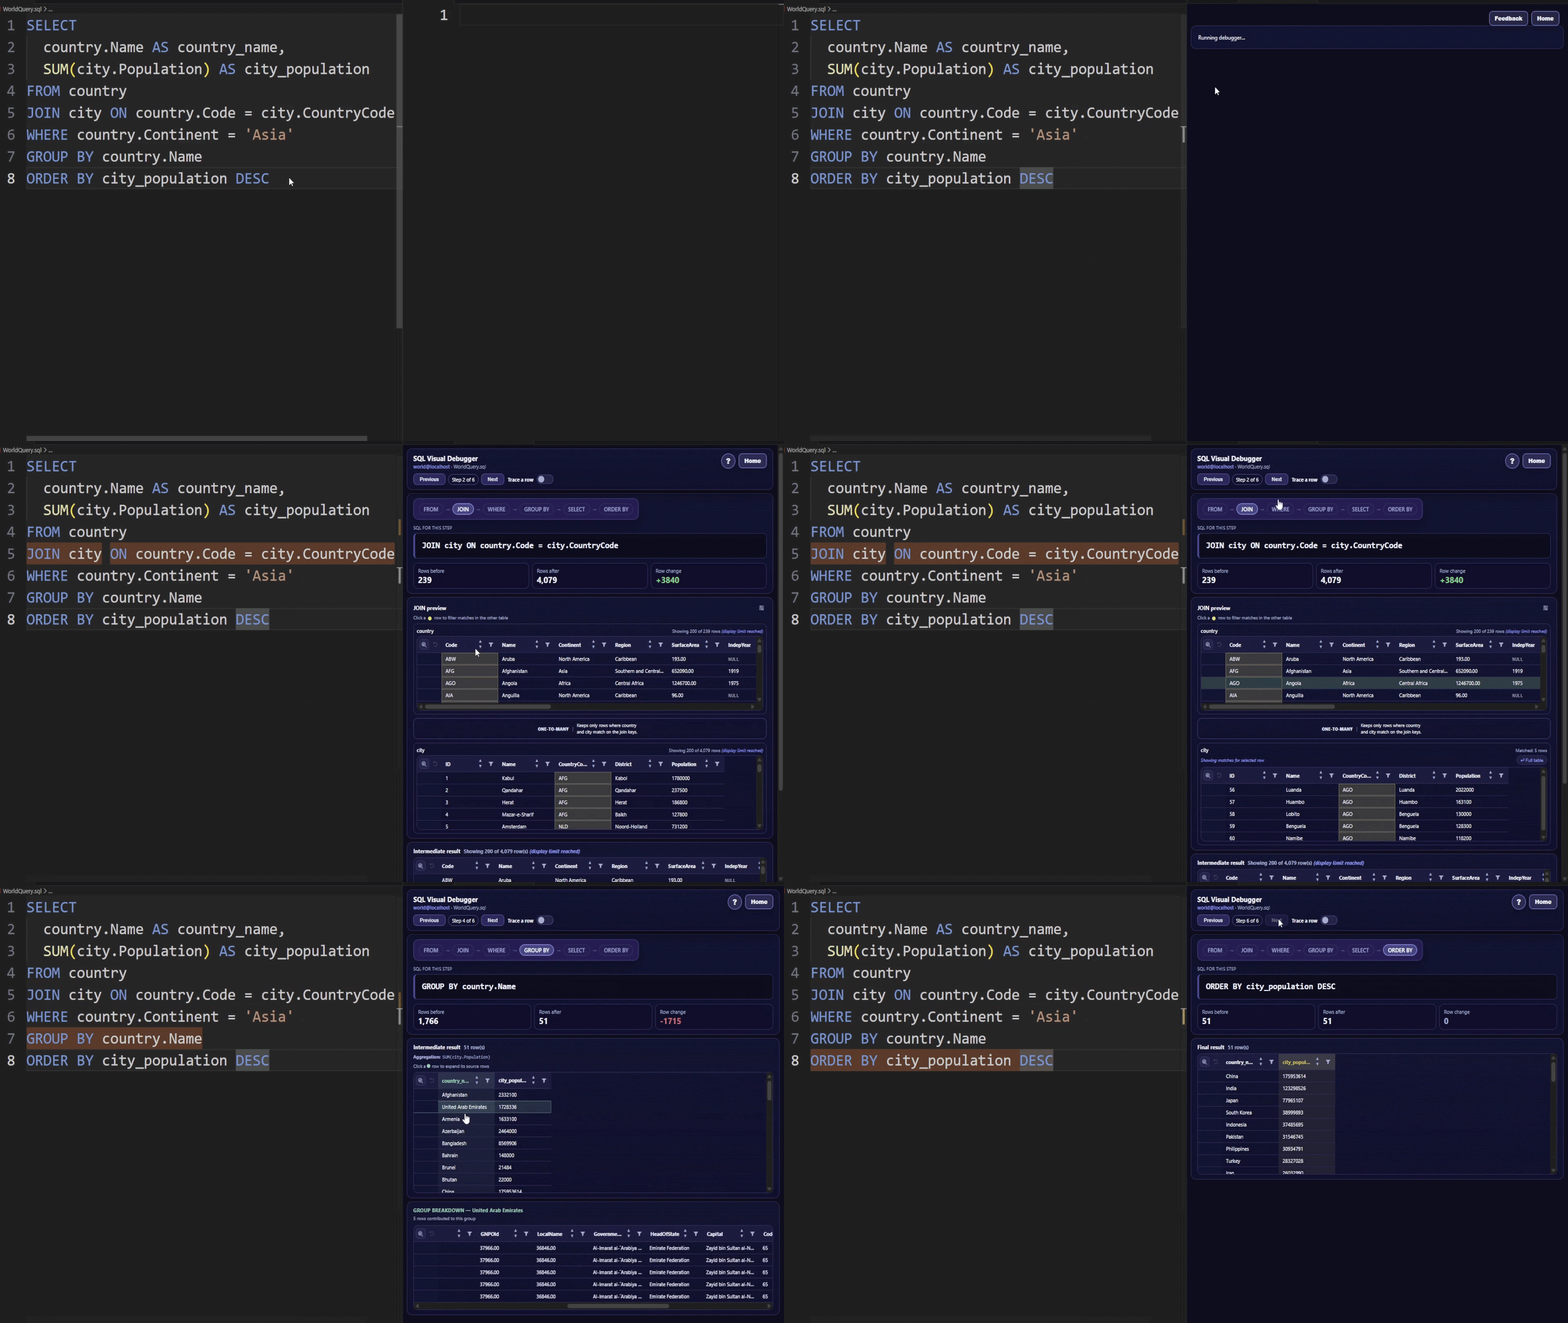
Debug SQL the way you debug code: step by step, with the intermediate state visible.
Stop guessing why a query returned the wrong rows
SQL bugs are hard because the final result does not show where the problem happened.
Was the row removed by WHERE?
Duplicated by a JOIN?
Grouped away by GROUP BY?
Filtered after aggregation by HAVING?
Changed by SELECT, CASE WHEN, or a window function?
SQL Visual Debugger shows each stage of the query so you can find the exact step where the result changed.
Trace rows through the query
Follow one row, or a set of matching rows, across the query flow.
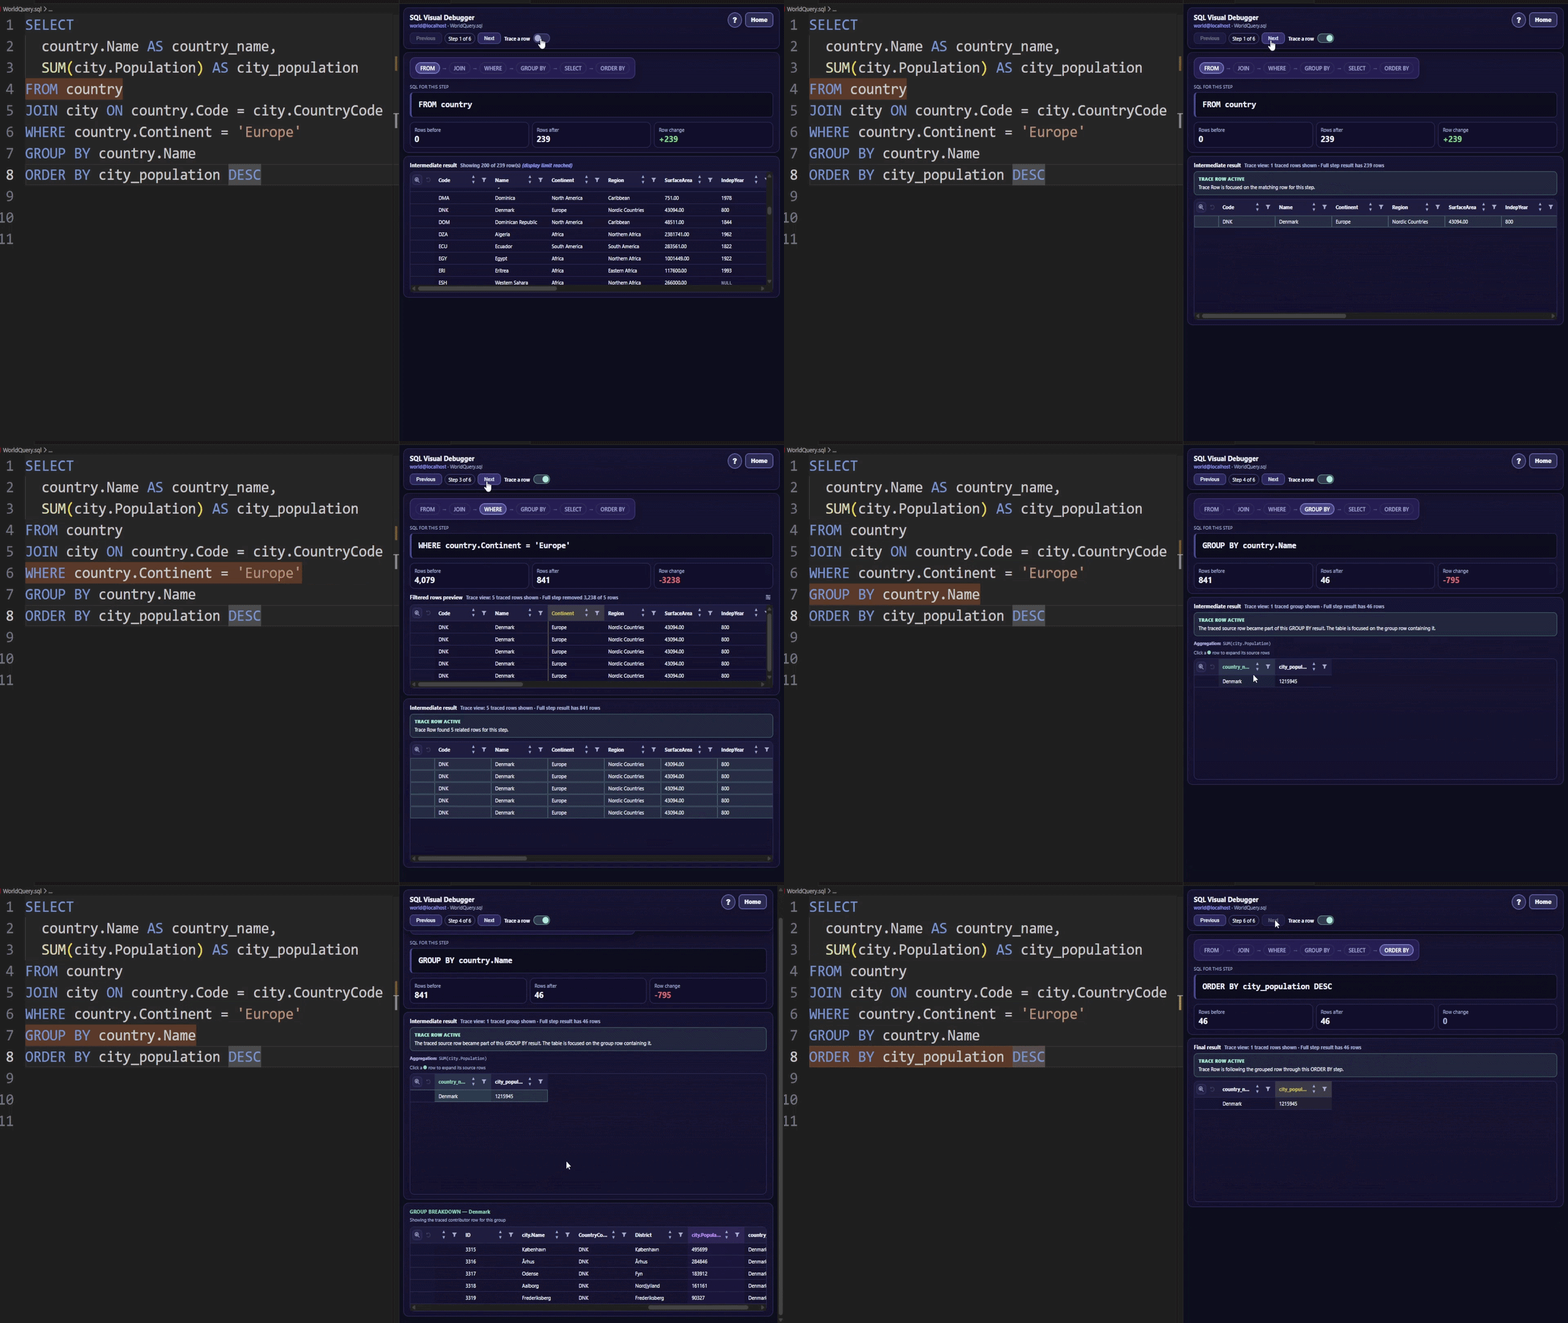
Trace rows backward and forward through the debugger to see where they came from, how they changed, whether they matched a join, and where they disappeared.
Inspect intermediate results
Sort, filter, and inspect intermediate tables while you debug.
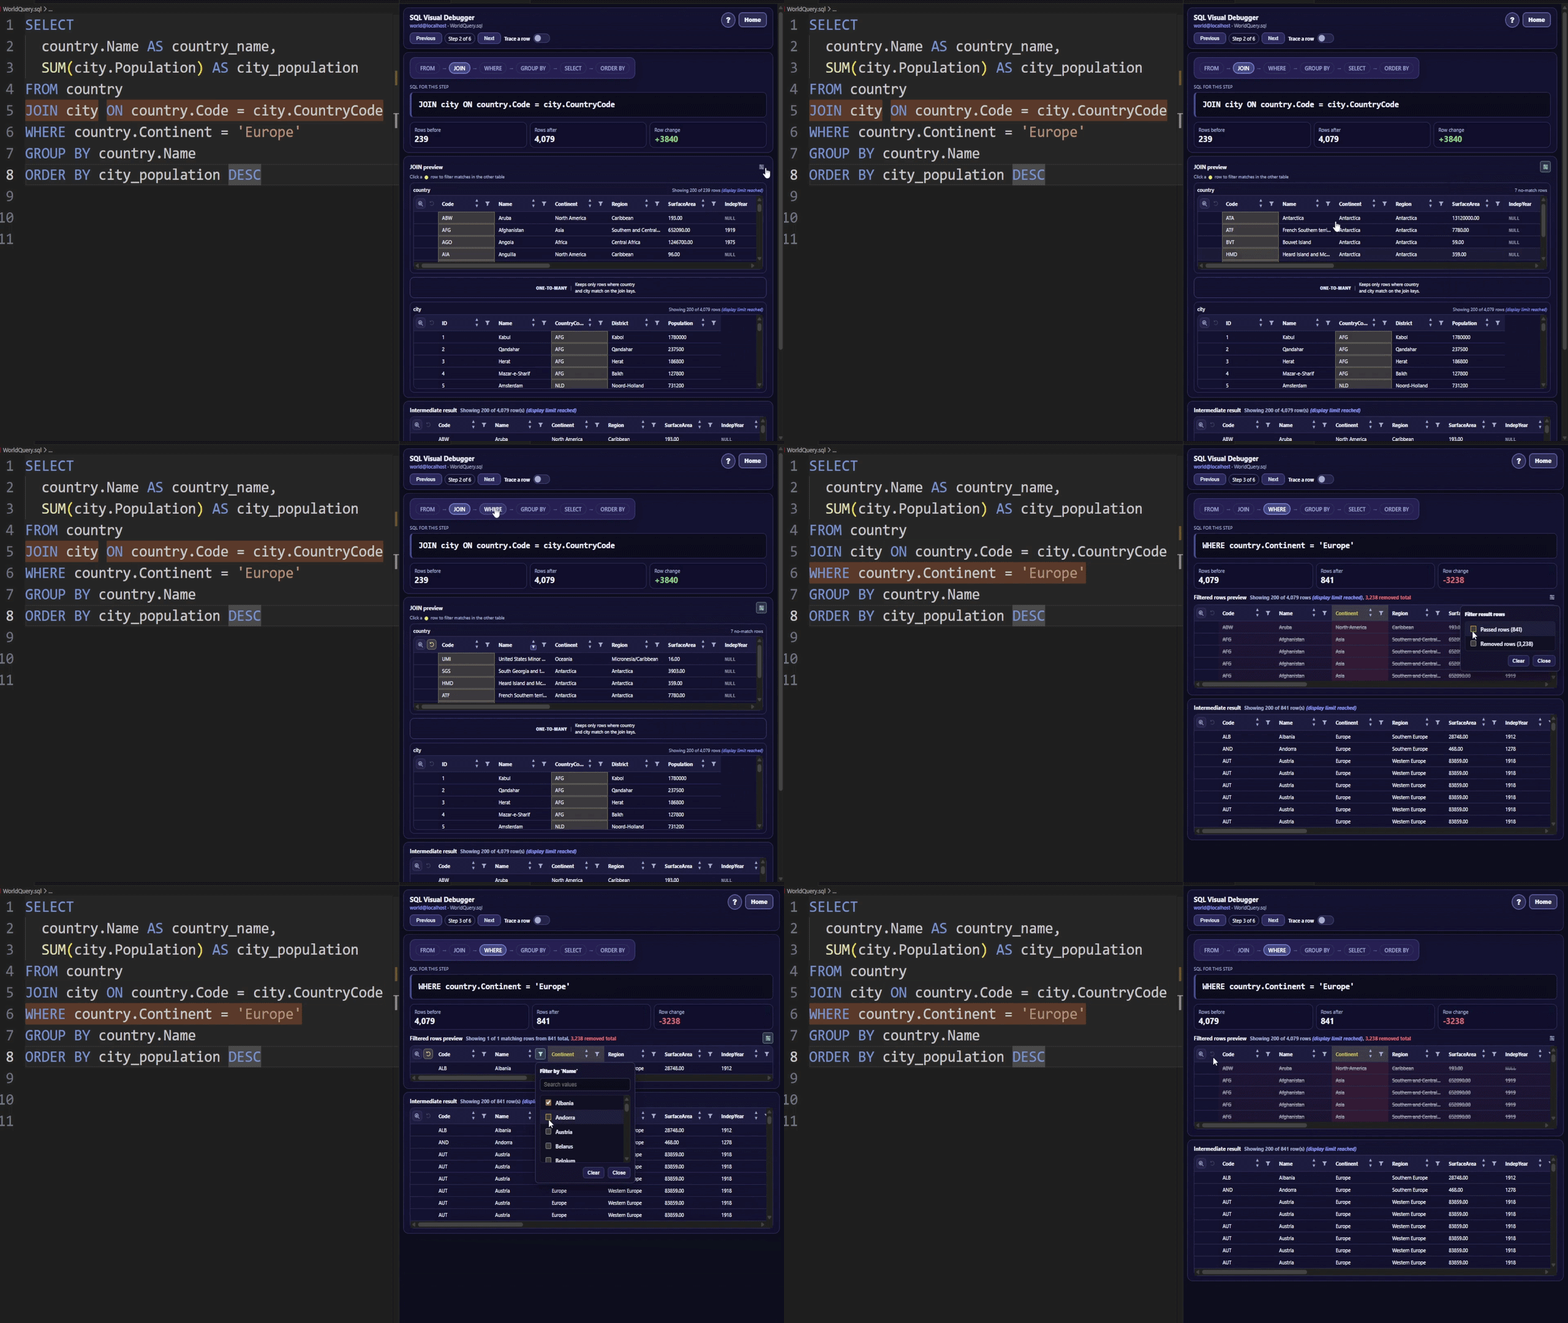
Use table filters and sorting to narrow large result sets, inspect JOIN matches, and review WHERE/HAVING filter previews without leaving the visual debugger.
What you can debug
SQL Visual Debugger works with sample data in the free demo, and can also debug your own real data after activation.
Supported real data sources:
- Excel files
- CSV files
- SQLite: local database files
- MySQL: local or remote host, optional SSL, or a MySQL/MariaDB connection string
- PostgreSQL: local or remote host, optional SSL, or a PostgreSQL connection string
- SQL Server: local Windows Authentication, or local/remote SQL Server Authentication
Remote SQL Server connections require SQL Server Authentication and Encrypt.
Try the free demo
No database or file ready? Try the free demo with sample data.
- Open the Command Palette.
- Run
SQL Visual Debugger: Try Free Demo. - Step through the sample query with
NextandPrevious.
The free demo is free forever and does not require a license.
Unlock real data debugging
The free demo is free forever. Debugging your own Excel files, CSV files, SQLite databases, MySQL databases, PostgreSQL databases, or SQL Server databases requires a one-time lifetime license.
- Launch price: $9.99 lifetime
- Taxes may apply at checkout depending on your location
- One-time payment
- No subscription
To purchase Premium, open SQL Visual Debugger in VS Code and select Unlock Real Data.
Before continuing to checkout, you will be asked to agree to the Terms of Use and acknowledge the Privacy Policy.
After purchase:
- Copy the license key from your Lemon Squeezy receipt or order page.
- Open SQL Visual Debugger in VS Code.
- Choose
SQL Visual Debugger: Enter License Key. - Paste the license key.
- Start debugging your own data.
Use it on your own SQL
You can start from a .sql file, Excel file, CSV file, or database connection.
- Open a
.sqlfile. - Select one supported
SELECTquery, or place your cursor inside it. - Right-click and choose
SQL Visual Debugger: Debug Query. - Choose your Excel/CSV file or connect to your database.
- Step through the visual result.
You can also open SQL Visual Debugger from the VS Code Activity Bar, the bottom status bar, or the CodeLens above your SQL query.
Debugging tools
SQL Visual Debugger includes:
- step-by-step intermediate results
- row tracing across query steps
- sortable and filterable result tables
- JOIN match inspection
- WHERE and HAVING filter previews
- GROUP BY source-row breakdowns
- DISTINCT value previews
- CASE WHEN result explanations
- window-function previews
- row-count changes between steps
Supported SQL
SQL Visual Debugger focuses on readable SELECT and WITH analysis queries and supports:
FROMJOINWHEREGROUP BYHAVINGSELECTDISTINCTORDER BYLIMIT/TOPCASE WHEN- aggregate functions
- supported window functions
- CTEs
- supported
FROMsubqueries - supported
WHEREscalar subqueries - supported
WHERE ... IN (...)subqueries - supported
WHERE EXISTS (...)subqueries
Current boundaries
Some advanced SQL shapes are intentionally limited today, including UNION, recursive CTEs, non-equality joins, mutations, stored procedures, and some advanced subquery/window-function syntax.
When a query is outside the supported visual-debugging shape, the extension stops with a clear message instead of pretending to debug it.
Safety and privacy
SQL Visual Debugger is built for read-only debugging.
- Runs supported read-only
SELECTandWITHquery shapes - Blocks non-read-only SQL before execution
- Does not save passwords
- Keeps passwords only in session memory
Optional limited usage telemetry helps improve reliability and prioritize future support.
The extension does not intentionally include SQL query text, table names, column names, database names, credentials, hostnames, query results, database contents, or file paths in usage telemetry.
SQL queries, schema information, query results, database credentials, and file contents are not routed through servers or cloud infrastructure operated by Ariel Turgeman.
Telemetry can be disabled with:
SQL Visual Debugger: Disable Telemetry
Legal
Feedback and issues
Found a bug, need help, or have feedback?
Email me at [email protected], or open an issue in the SQL Visual Debugger feedback repository.